Vue项目中ECharts图表不显示问题
相关文章:
ECharts官网
在Vue项目中使用ECharts
最近在工作中需要使用ECharts绘制图表,所以根据参考文档尝试了一番,遇到了图表不显示的问题。
后来参考了网上许多解决方案,最终发现,原来是因为自己没给图表组件设置height。现记录如下:
<ability-line style="width:100%;height:300px;"></ability-line>
ability-line不是ECharts封装组件,是自己编写的组件,需要使用imports导入并使用components映射成组件,其代码如下:
<template><div id="ve-histogram"></div></template><script> export default { data() { return { options: { color: ['#ffdf25', '#36a9ce', '#d0e17d'], tooltip: { trigger: 'axis', axisPointer: { type: 'shadow' } }, grid: { left: '0%', right: '0%', bottom: '10%', top: '10%', containLabel: true }, calculable: true, xAxis: [ { type: 'category', axisTick: { show: false }, data: ['1月', '2月', '3月'] } ], yAxis: [ { type: 'value' } ], series: [ { name: '全国平均业绩', type: 'bar', barGap: 0, data: [320, 332, 301] }, { name: '地区平均业绩', type: 'bar', data: [220, 182, 191] }, { name: '业务员业绩', type: 'bar', data: [150, 232, 201] } ] } }; }, mounted() { const dom = document.getElementById('ve-histogram'); if (dom.getAttribute('_echarts_instance_') !== null) { this.chart = this.$echarts.getInstanceByDom(dom); this.chart.setOption({ }, true); } else { this.chart = this.$echarts.init(dom); } this.$nextTick(() => { this.chart.setOption(this.options, true); }); window.addEventListener('resize', () => { this.chart.resize(); }); } }; </script><style scoped> </style>
问题解决: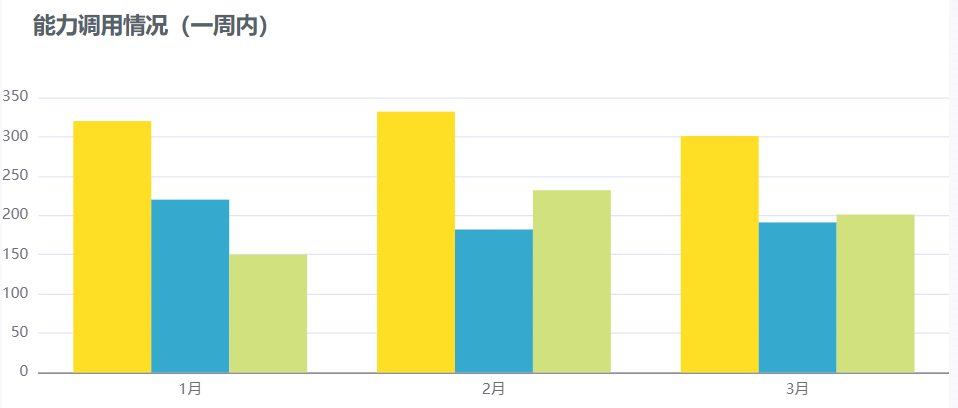


还没有评论,来说两句吧...