Vue中使用echarts图表
一、安装引入echarts插件
安装
npm install echarts -S
在main.js中配置引入
// 引入echartsimport echarts from 'echarts'Vue.prototype.$echarts = echartsVue.use(echarts)
二、使用
<template><!-- 为 ECharts 准备一个具备大小(宽高)的 DOM --><div id="main" style="width: 800px;height:600px;font-size: 20px;margin-left: 50px;padding: 10px"></div></template><script>export default {name: "echart-sales",data() {return {getSalesUrl: '/manage/category/getSales',data1: [],dataName: []}},methods: {getEchars() {// 基于准备好的dom,初始化echarts实例var myChart = this.$echarts.init(document.getElementById('main'));console.log("获取echarts表");// 指定图表的配置项和数据var option = {title: {text: '图书销量图例',subtext: '按类别进行统计',x: 'center',textStyle: {fontSize: 30}},tooltip: {trigger: 'item',formatter: "{a} <br/>{b} : {c} ({d}%)"},legend: {orient: 'vertical',left: 'left',data: this.dataName,textStyle: {fontSize: 20 // 用 legend.textStyle.fontSize 更改示例大小}},series: [{name: '访问来源',type: 'pie',radius: '55%',center: ['50%', '60%'],data: this.data1,itemStyle: {emphasis: {shadowBlur: 10,shadowOffsetX: 0,shadowColor: 'rgba(0, 0, 0, 0.5)'},normal: {label: {textStyle: {// 用 itemStyle.normal.label.textStyle.fontSize 來更改餅圖上項目字體大小fontSize: 20}}}}}]};// 使用刚指定的配置项和数据显示图表。myChart.setOption(option);}},mounted:function() {//挂载前请求数据this.$http.get(this.getSalesUrl).then((res) => {console.log(res);this.data1 = res.data.data;console.log(this.data1);for (var i = 0; i < this.data1.length; i++) {this.dataName[i] = this.data1[i].name;}//渲染数据this.getEchars();})}}</script><style scoped></style>
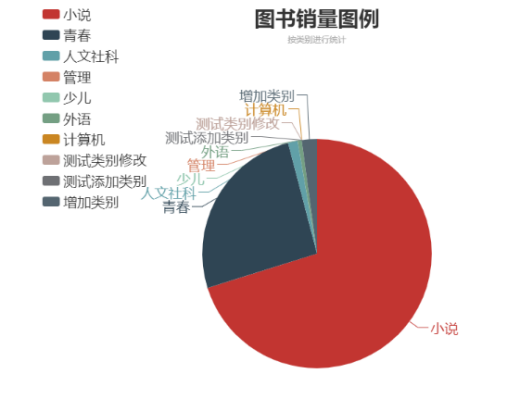
三、运行


—— 图和会话")
—— 保存和恢复")
—— 开始Python之旅")
—— 变量和数据类型")


还没有评论,来说两句吧...