Hystrix Dashboard - 数据监控
- Hystrix dashboard是一款针对Hystrix进行实时监控的工具,通过Hystrix Dashboard我们可以在直观地看到各Hystrix Command的请求响应时间, 请求成功率等数据。
添加依赖
org.springframework.boot
spring-boot-starter-actuator
org.springframework.cloud
spring-cloud-starter-netflix-hystrix-dashboard 在main方法中添加配置信息
@Bean
public ServletRegistrationBean getServlet() {HystrixMetricsStreamServlet streamServlet = new HystrixMetricsStreamServlet();ServletRegistrationBean registrationBean = new ServletRegistrationBean(streamServlet);registrationBean.setLoadOnStartup(1); //系统启动时加载顺序registrationBean.addUrlMappings("/hystrix.stream");//路径registrationBean.setName("HystrixMetricsStreamServlet");return registrationBean;}
在启动器上增加注解@EnableHystrixDashboard、@EnableHystrix,启动工程后,如果触发了Hystrix,则可以通过http://ip:port/hystrix.stream得到监控数据。
这种监控数据的获取都是JSON数据。且数据量级较大。不易于查看。可以使用Hystrix Dashboard提供的视图界面来观察监控结果。视图界面访问路径为: http://ip:port/hystrix。视图界面中各数据的含义如下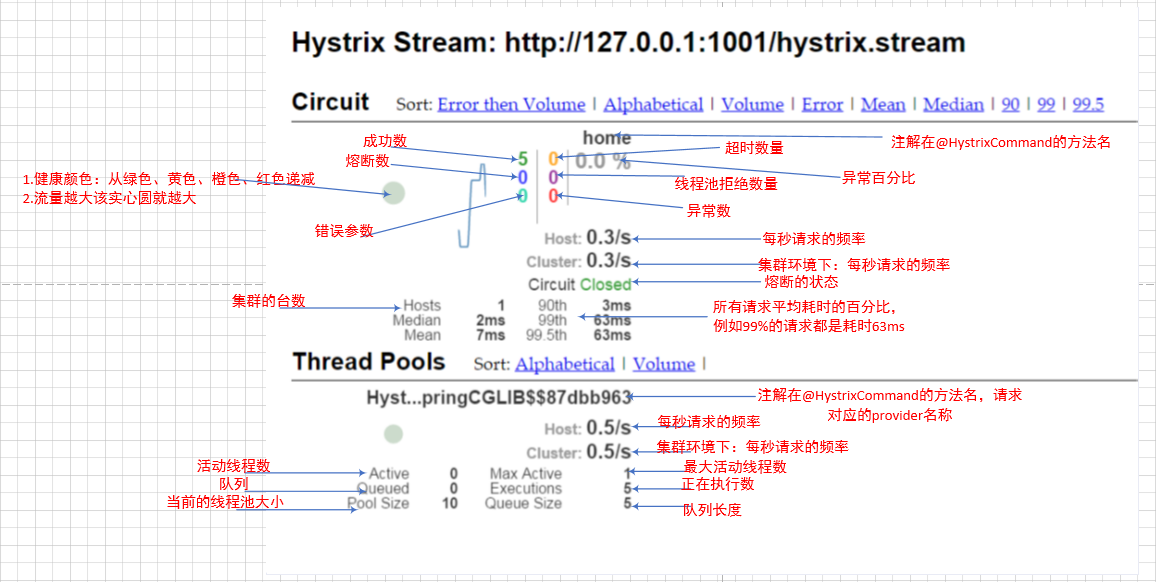
建议:监控中心建议使用独立工程来实现。这样更便于维护。


还没有评论,来说两句吧...