Hystrix Dashboard监控面板
Hystrix Dashboard监控面板
概述
本篇博文引入Hystrix Dashboard实现对微服务的实时监控及界面化监控。
实现步骤分析
引入相关依赖依赖
<dependencies><dependency><groupId>org.springframework.cloud</groupId><artifactId>spring-cloud-starter-netflix-hystrix-dashboard</artifactId></dependency></dependencies>
创建application.yml文件
spring:application:name: hystrix-dashboardserver:port: 9100
创建springcloud-hystrix-dashboard启动类
import org.springframework.boot.SpringApplication;import org.springframework.boot.autoconfigure.SpringBootApplication;import org.springframework.cloud.netflix.hystrix.dashboard.EnableHystrixDashboard;@EnableHystrixDashboard // 启动hystrix监控面板@SpringBootApplicationpublic class Application {public static void main(String[] args) throws Exception {SpringApplication.run(Application.class, args);}}
此时,启动项目,并在浏览器里访问http://localhost:9100/hystrix/即可进入Hystrix Dashboard监控首页面,如下图所示: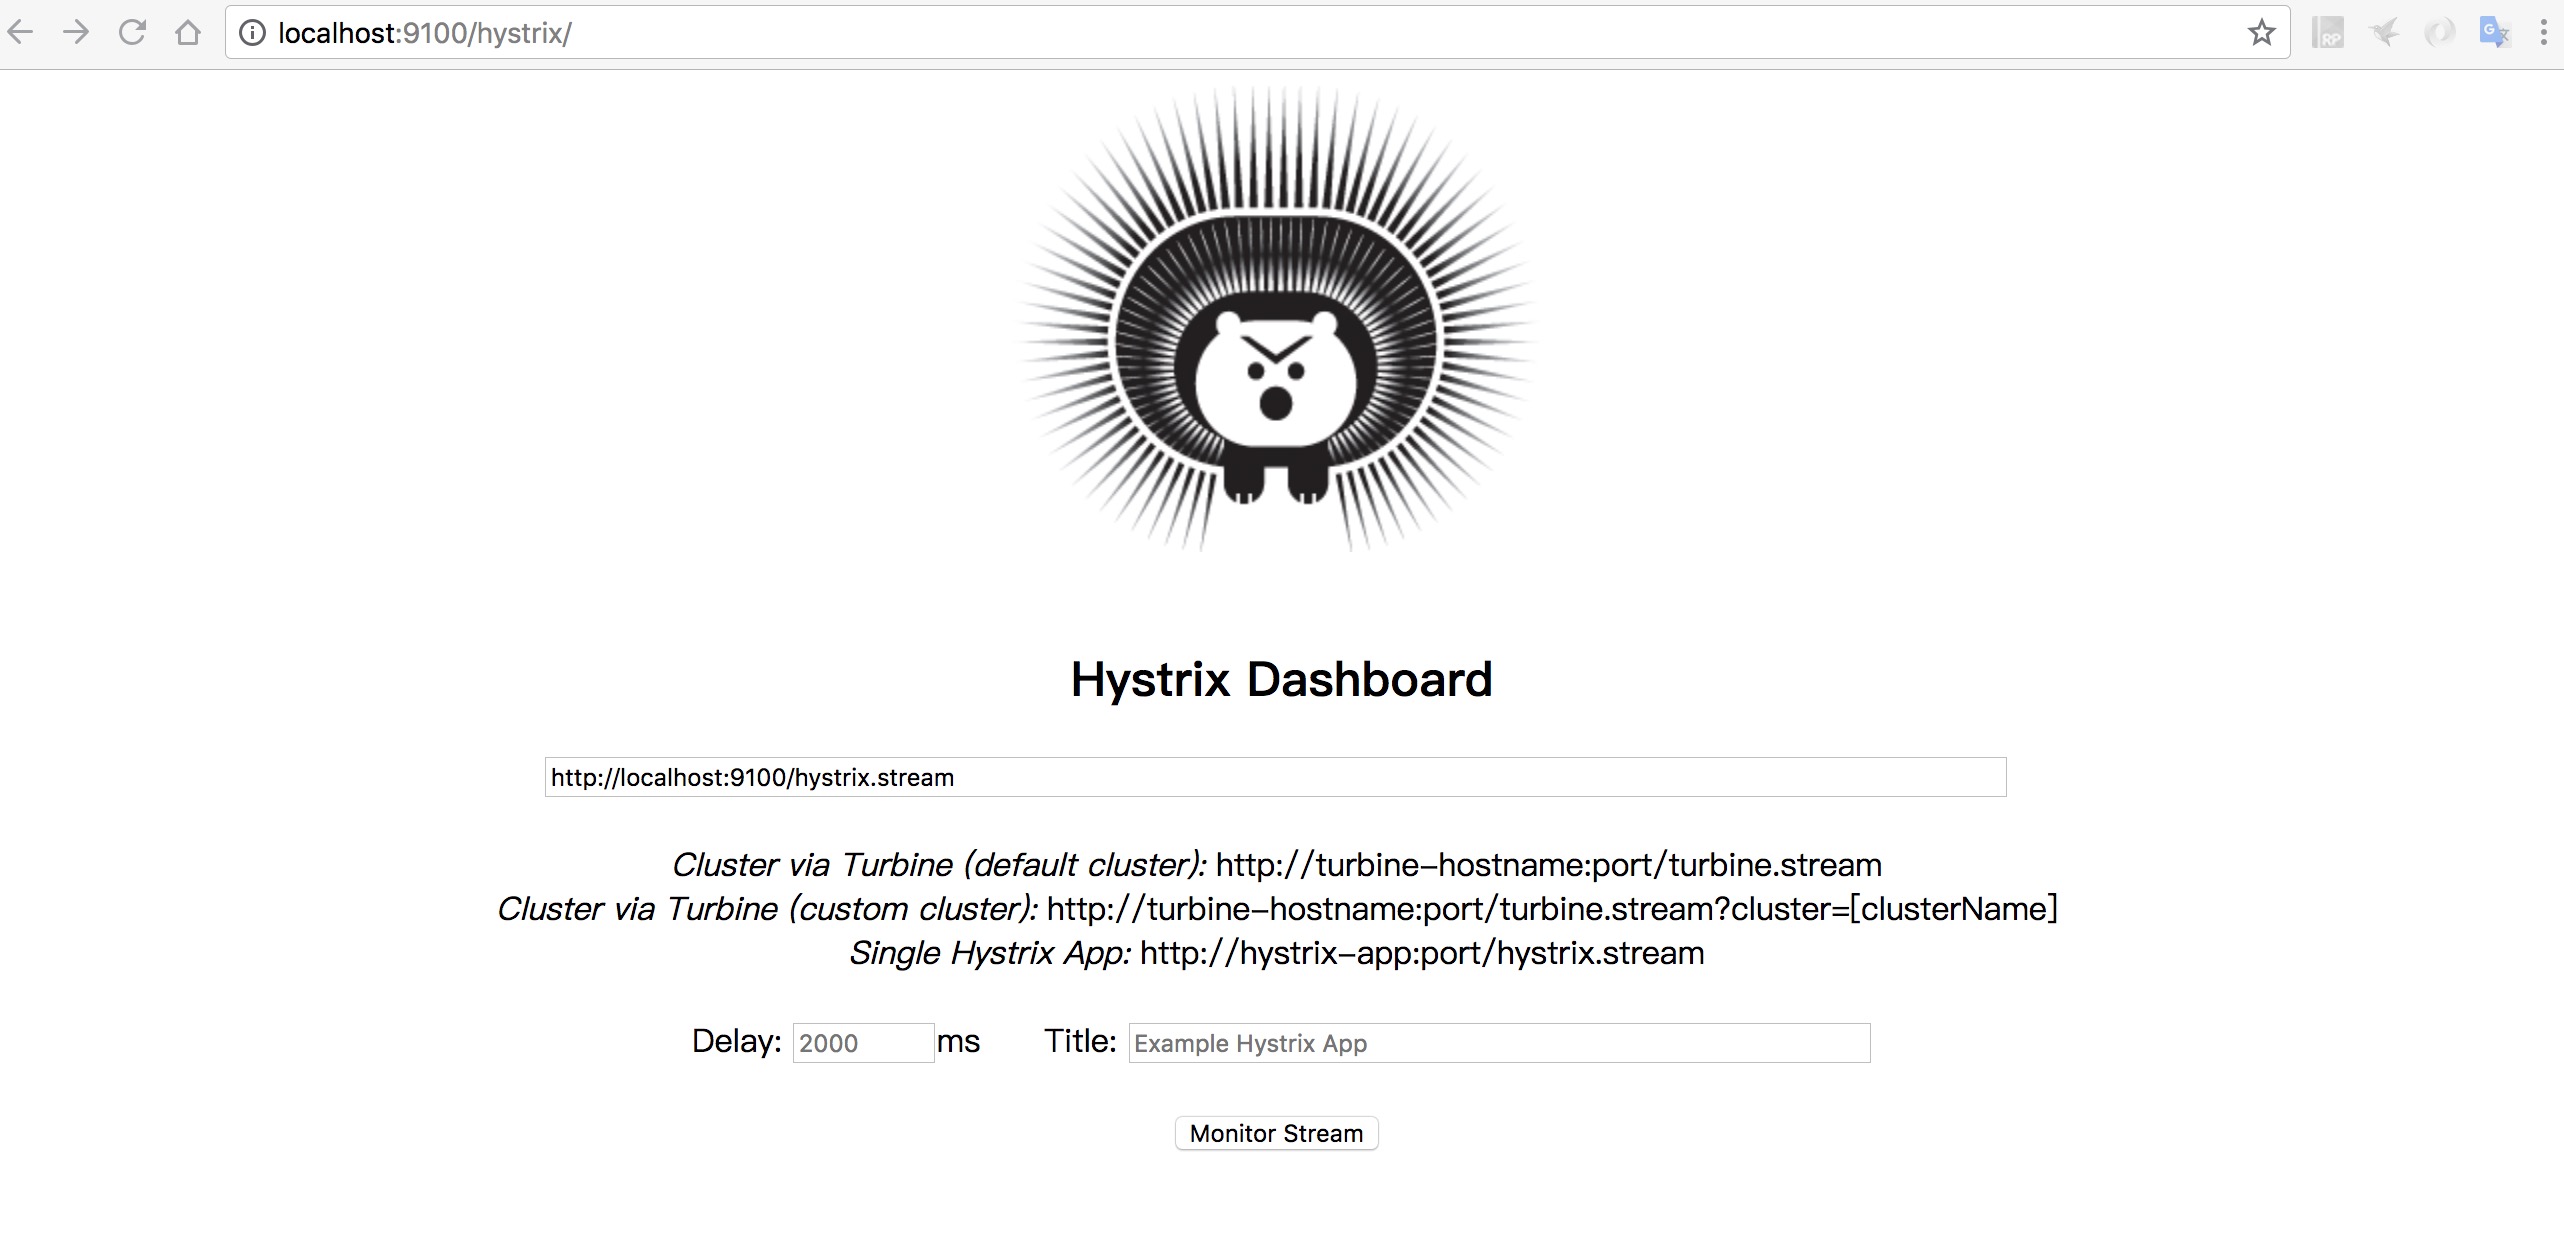
监控首页面根据不同的架构模式提供了有一种监控方式:
- Cluster via Turbine (default cluster): http://turbine-hostname:port/turbine.stream(这是针对Turbine集群(默认集群))
- Cluster via Turbine (custom cluster): http://turbine-hostname:port/turbine.stream?cluster=clusterName
- Single Hystrix App: http://hystrix-app:port/hystrix.stream(单体应用模式)
以上仅实现了Hystrix Dashboard监控系统搭建,下面介绍如何实现对服务的监控
Hystrix Dashboard服务监控
Single Hystrix App单体应用模式
要实现服务的监控,需要修改被监控服务的配置及依赖,本例以springcloud-service-consumer-feign-hystrix这个工程为服务消费端介绍如何实现监控。
修改消费端pom依赖,引入Hystrix Dashboard依赖
需要增加以下依赖:
<dependency><groupId>org.springframework.cloud</groupId><artifactId>spring-cloud-starter-netflix-hystrix</artifactId></dependency><dependency><groupId>org.springframework.boot</groupId><artifactId>spring-boot-starter-actuator</artifactId></dependency>
启动熔断机制
在主启动类上增加@EnableCircuitBreaker
修改后的启动类如下:
@SpringBootApplication@EnableFeignClients // 启动Feign@EnableCircuitBreaker // 启动熔断机制public class Application {public static void main(String[] args) throws Exception {SpringApplication.run(Application.class, args);}}
测试
分别启动springcloud-hystrix-dashboard和springcloud-service-consumer-feign-hystrix这两个工程,在浏览器里多次访问http://localhost:9000/consumer/request/info,并通过http://localhost:9100/hystrix/monitor?stream=http://localhost:9000/hystrix.stream即可查看监控的详细信息,如下图: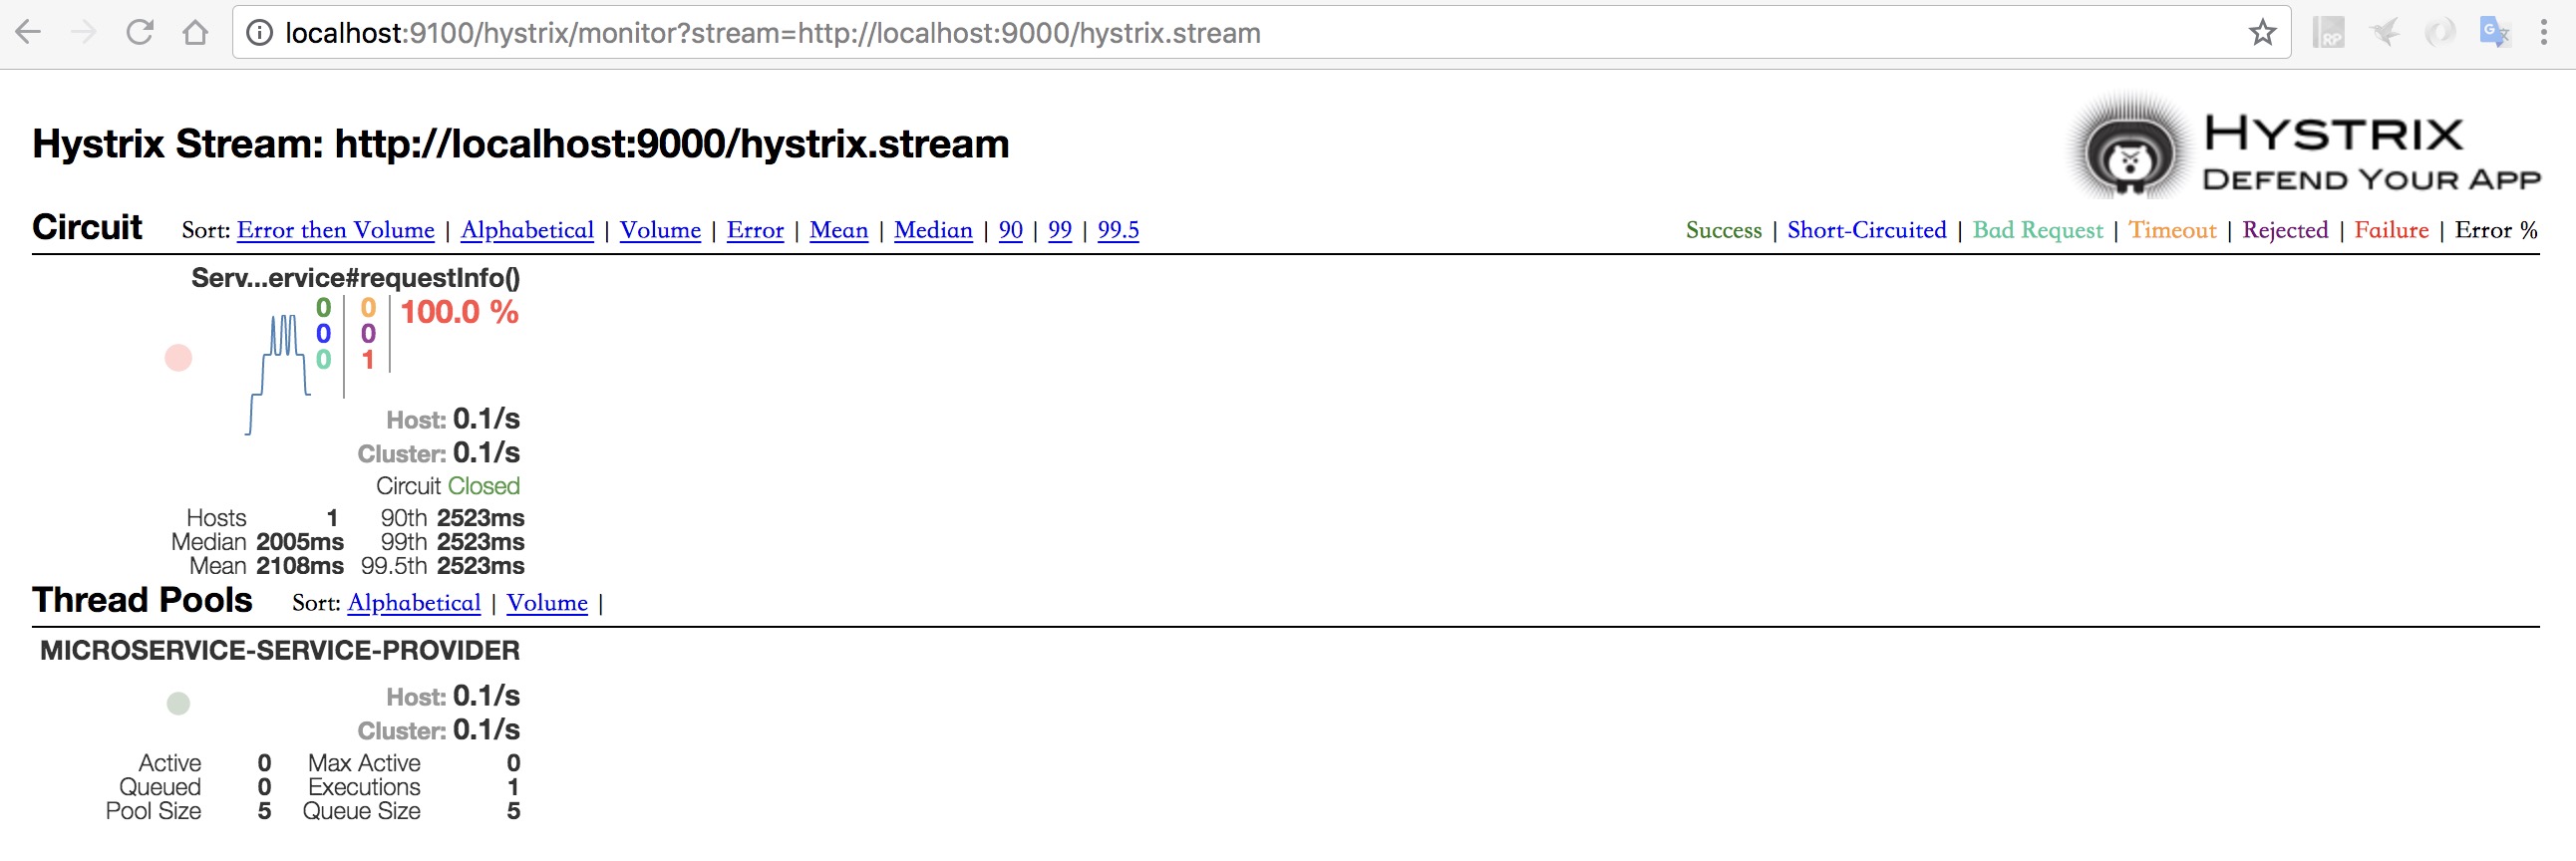
Cluster via Turbine (default cluster) | Cluster via Turbine (custom cluster)
后续补齐
源代码链接:
https://github.com/myNameIssls/springcloud-study/tree/master/springcloud-hystrix-dashboard
参考链接:
http://cloud.spring.io/spring-cloud-static/Finchley.SR1/multi/multi__circuit_breaker_hystrix_dashboard.html
http://cloud.spring.io/spring-cloud-static/Finchley.SR1/multi/multi__hystrix_timeouts_and_ribbon_clients.html
https://blog.csdn.net/yejingtao703/article/details/77683102
https://www.cnblogs.com/chenweida/p/9025589.html


")


还没有评论,来说两句吧...