K8s可视化监控告警【2】--Grafana部署
1. app部署
apiVersion: v1kind: ReplicationControllermetadata:name: grafana-corenamespace: kube-systemlabels:monitor: grafanacomponent: corespec:replicas: 1template:metadata:labels:monitor: grafanacomponent: corespec:tolerations:- key: node-role.kubernetes.io/masteroperation: Equaleffect: NoSchedulecontainers:- image: grafana/grafana:4.2.0name: grafana-coreimagePullPolicy: IfNotPresent# env:resources:# keep request = limit to keep this container in guaranteed classlimits:cpu: 100mmemory: 100Mirequests:cpu: 100mmemory: 100Mienv:# The following env variables set up basic auth twith the default admin user and admin password.- name: GF_AUTH_BASIC_ENABLEDvalue: "true"- name: GF_AUTH_ANONYMOUS_ENABLEDvalue: "false"# - name: GF_AUTH_ANONYMOUS_ORG_ROLE# value: Admin# does not really work, because of template variables in exported dashboards:# - name: GF_DASHBOARDS_JSON_ENABLED# value: "true"readinessProbe:httpGet:path: /loginport: 3000# initialDelaySeconds: 30# timeoutSeconds: 1volumeMounts:- name: grafana-persistent-storagemountPath: /varvolumes:- name: grafana-persistent-storageemptyDir: { }---apiVersion: v1kind: Servicemetadata:name: grafananamespace: kube-systemlabels:monitor: grafanacomponent: corespec:type: NodePortports:- port: 3000 # 访问服务名即可跳转到对于目标容器端口protocol: TCPtargetPort: 3000 # 容器开放端口nodePort: 33000 # 绑定集群节点端口selector:monitor: grafanacomponent: core
访问URL:http://节点IP:33000
2. 添加数据源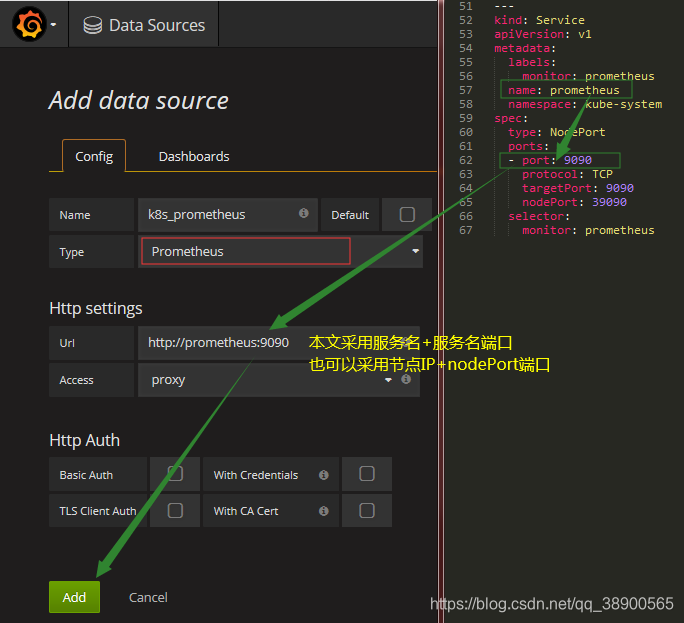
3. 添加模板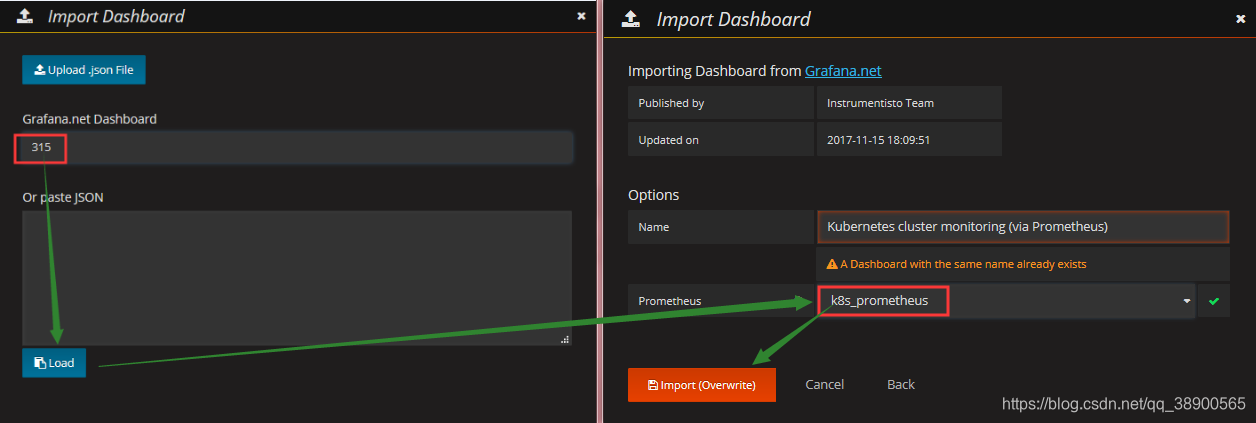
访问http://节点IP:33000/dashboard/db/kubernetes-cluster-monitoring-via-prometheus?refresh=10s&orgId=1


")


还没有评论,来说两句吧...