networkx画弯曲的边
networkx里面自绘的边都是直的,当多个节点处于同一条直线还有连边的时候就特别难看。如果能否让networkx画弯曲的边,那么这种情况就可以好办的多了。
思路为:
- 绘制节点,获取节点的pos坐标。
- 在存在边的两个节点之间,使用贝塞尔插值生成两个节点之间曲线的节点坐标。
- 使用LineCollection绘制线即可。
下面为整理的代码:
__author__ = 'jmh081701'import matplotlib.pyplot as pltimport numpy as npimport bezierfrom matplotlib.collections import LineCollectionimport networkx as nximport randomG = nx.Graph()G.add_nodes_from([0,1,2,3])G.add_edge(0,1,weight=0.1)G.add_edge(1,2,weight=0.2)G.add_edge(0,2,weight=0.3)G.add_edge(1,3,weight=0.4)graph = Gdef curved_line(x0, y0, x1, y1, eps=0.2, pointn=30):x2 = (x0+x1)/2.0 + 0.1 ** (eps+abs(x0-x1)) * (-1) ** (random.randint(1,4))y2 = (y0+y1)/2.0 + 0.1 ** (eps+abs(y0-y1)) * (-1) ** (random.randint(1,4))nodes = np.asfortranarray([[x0, x2, x1],[y0, y2, y1]])curve = bezier.Curve(nodes,degree=2)s_vals = np.linspace(0.0, 1.0, pointn)data=curve.evaluate_multi(s_vals)x=data[0]y=data[1]segments =[]for index in range(0,len(x)):segments.append([x[index],y[index]])segments = [segments]return segmentsdef curved_graph(_graph, pos = None, eps=0.2, pointn=30):if pos == None:pos = nx.spring_layout(graph)for u,v in graph.edges():x0, y0 = pos[u]x1, y1 = pos[v]segs = curved_line(x0,y0,x1,y1)lc = LineCollection(segs)plt.gca().add_collection(lc)plt.gca().autoscale_view()if __name__ == '__main__':#画节点pos = nx.spring_layout(graph)nx.draw_networkx_nodes(G,pos, with_label=True)nx.draw_networkx_edges(G,pos)plt.show()#画曲线nx.draw_networkx_nodes(G,pos, with_label=True)curved_graph(graph,pos)plt.show()
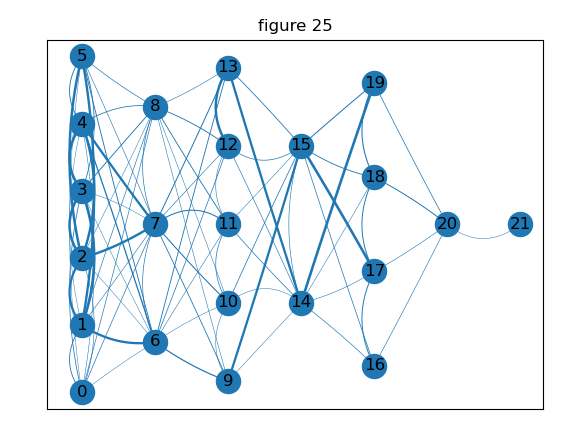
直线连边版:
贝塞尔曲线连边版: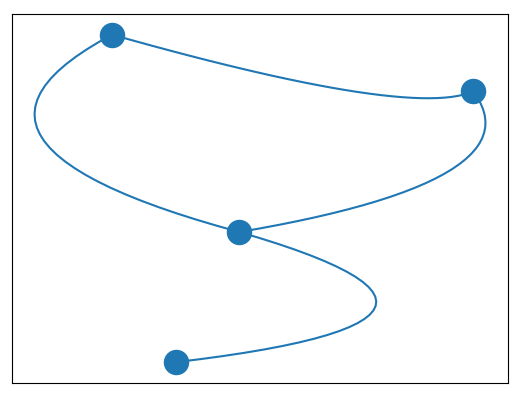


")


还没有评论,来说两句吧...