【Python】Matplotlib画图(十)——基于networkx画关系网络图
前言
昨天才开始接触,鼓捣了一个下午,接下来会持续更新,如果哪里有错误的地方,望各位大佬指出,谢谢!
数据描述
两个文件,一个文件包含了网络图的节点,节点存在类别(0,1,2,3)四类,但是0类别舍去,不画出;另一个文件包含了网络图的边,数据基本特征如下:

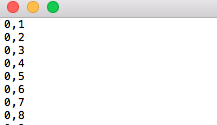
图1中,id表示节点,b是类别;图2中,两个数字表示边连接的两个点。
Networkx
安装
我的系统是Mac OS,直接在terminal输入sudo pip install networkx就可以安装,由于代码中涉及几个函数,在python3中会报错,我用python2.7.13实现的
基本使用方法
import networkx as nx #导入networkx包import matplotlib.pyplot as plt #导入绘图包matplotlib(需要安装,方法见第一篇笔记)G =nx.random_graphs.barabasi_albert_graph(100,1) #生成一个BA无标度网络Gnx.draw(G) #绘制网络Gplt.savefig("ba.png") #输出方式1: 将图像存为一个png格式的图片文件plt.show() #输出方式2: 在窗口中显示这幅图像
参数介绍
基本
- `node_size`: 指定节点的尺寸大小(默认是300,单位未知,就是上图中那么大的点)
- `node_color`: 指定节点的颜色 (默认是红色,可以用字符串简单标识颜色,例如’r’为红色,’b’为绿色等,具体可查看手册)
- `node_shape`: 节点的形状(默认是圆形,用字符串’o’标识,具体可查看手册)
- `alpha`: 透明度 (默认是1.0,不透明,0为完全透明)
- `width`: 边的宽度 (默认为1.0)
- `edge_color`: 边的颜色(默认为黑色)
- `style`: 边的样式(默认为实现,可选: solid|dashed|dotted,dashdot)
- `with_labels`: 节点是否带标签(默认为True)
- `font_size`: 节点标签字体大小 (默认为12)
- `font_color`: 节点标签字体颜色(默认为黑色)
布局
circular_layout:节点在一个圆环上均匀分布
random_layout:节点随机分布
shell_layout:节点在同心圆上分布
spring_layout: 用Fruchterman-Reingold算法排列节点
spectral_layout:根据图的拉普拉斯特征向量排列节点
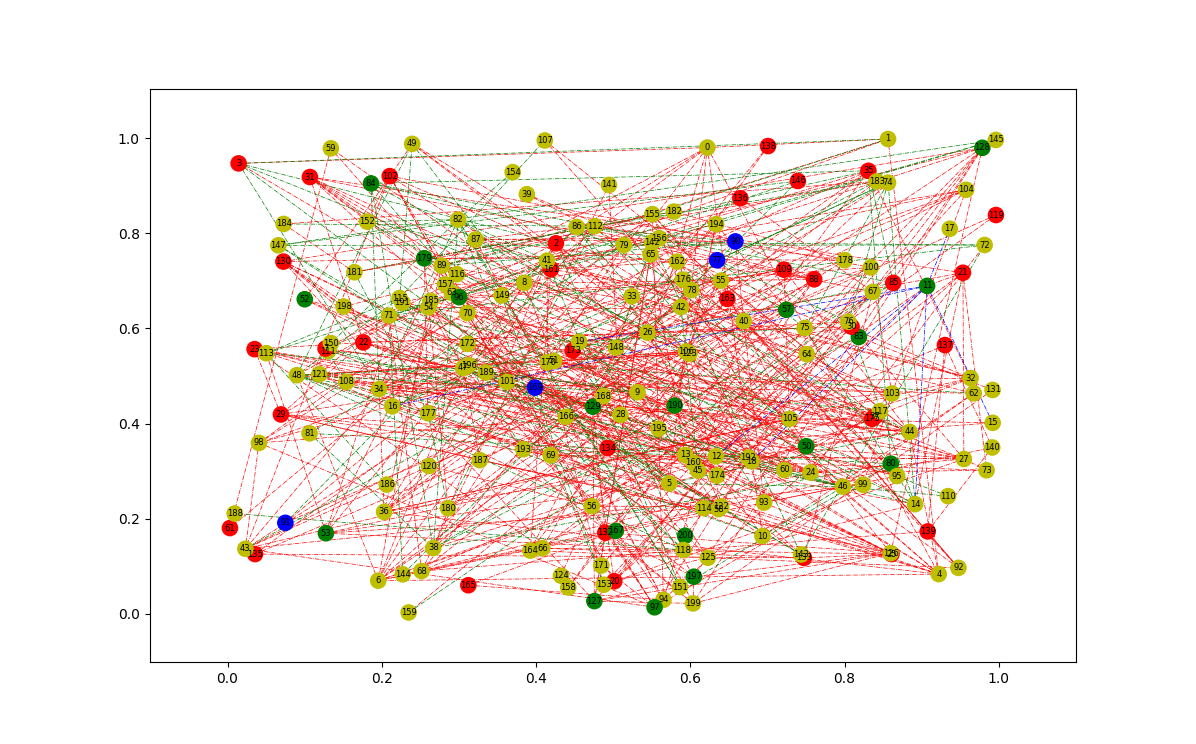
代码
# coding:utf-8import networkx as nximport matplotlib.pyplot as pltimport csvwith open('node-8.csv','rb') as csvfile:reader = csv.DictReader(csvfile)column = [row['b'] for row in reader]id_tag0 = [row['id'] for row in reader]#print columnid_tag = []for item in id_tag0:id_tag.append(int(item))# =================Setting node parameters====================node_0 = []node_1 = []node_2 = []node_3 = []node_color = []node_color_y = []node_color_r = []node_color_g = []node_color_b = []node_shape = []node_shape_0 = []node_shape_1 = []node_shape_2 = []node_shape_3 = []for i in range(len(column)):if int(column[i]) == 0:passelif int(column[i]) == 1:color = 'r'shape = 'o'node_1.append(i)node_color_r.append(color)node_shape_1.append(shape)elif int(column[i]) == 2:color = 'g'shape = 'o'node_2.append(i)node_color_g.append(color)node_shape_2.append(shape)else:color = 'b'shape = '*'node_3.append(i)node_color_b.append(color)node_shape_3.append(shape)node_color.append(color)node_shape.append(shape)# ==============================================================with open('node-8.csv','rb') as csvfile:reader = csv.DictReader(csvfile)column1 = [row['b'] for row in reader]id_tag1 = [row['id'] for row in reader]#print columnid_tag11 = []for item in id_tag1:id_tag11.append(int(item))edge = []with open('edge-8.txt','r') as f:data = f.readlines()for line in data:#print lineline = tuple(line.replace('\r','').replace('\n','').replace('\t','').split(','))edge.append(line)#print edge# ===============Setting edge parameters=========================edge_color = []edge_style = []for item in edge:#print itemif int(column1[int(item[0])]) == 0 or int(column1[int(item[1])]) == 0:passelif int(column1[int(item[0])]) == 1 or int(column1[int(item[1])]) == 1:color = 'r'#style0 = 'dashdot'#color_r_list.append(color)elif int(column1[int(item[0])]) == 2 or int(column1[int(item[1])]) == 2:color = 'g'#style0 = 'dashed'#color_r_list.append(color)else:color = 'b'#style0 = 'dotted'#color_b_list.append(color)edge_color.append(color)#edge_style.append(style0)G = nx.Graph()#G.add_nodes_from(id_tag)G.add_edges_from(edge)#nx.draw(G,pos=nx.random_layout(G), nodelist = node_0, node_color = node_color_y, node_size=120, node_shape=node_shape_0)#nx.draw(G,pos=nx.random_layout(G), nodelist = node_1, node_color = node_color_r, node_size=120, node_shape=node_shape_1)#nx.draw(G,pos=nx.random_layout(G), nodelist = node_2, node_color = node_color_g, node_size=120, node_shape=node_shape_2)#nx.draw(G,pos=nx.random_layout(G), nodelist = node_3, node_color = node_color_b, node_size=120, node_shape=node_shape_3)nx.draw_networkx(G,pos=nx.random_layout(G),node_color=node_color,node_size=10,node_shape='o',edge_color=edge_color,width=0.3,style='solid',font_size=8)#nx.draw_networkx(G,pos=nx.random_layout(G),nodelist = node_1,node_color=node_color,node_size=100,node_shape='o',style='dashdot')#nx.draw_networkx(G,pos=nx.random_layout(G),node_color=color_g_list,node_size=150,node_shape='^',style='dashed')#nx.draw_networkx(G,pos=nx.random_layout(G),node_color=color_b_list,node_size=150,node_shape='*',style='dotted')#plt.legend()#nx.draw_networkx(G)plt.show()
画图
参考链接
http://blog.sciencenet.cn/blog-404069-337865.html
https://www.zhihu.com/question/59653147
https://segmentfault.com/a/1190000000527216
https://networkx.github.io/documentation/networkx-1.10/tutorial/tutorial.html#what-to-use-as-nodes-and-edges


还没有评论,来说两句吧...