浅谈Echarts 使用配置
官方文档
一、Echarts折线图的配置
(1)去掉折线图的边框线及其加入阴影效果
lineStyle: {normal: {type: 'solid',/*color:"#28a5fc",*/color:"red",opacity :"0.5"}}
如下图所示:
(2)设置移动折线图的 “上下左右” 的位置
代码片段:
grid:{x:40,y:20,x2:20,y2:60,show:true, //表示开启borderColor:"#e4e4e4",//折线图的边宽颜色shadowBlur:50,containLabel:50,}
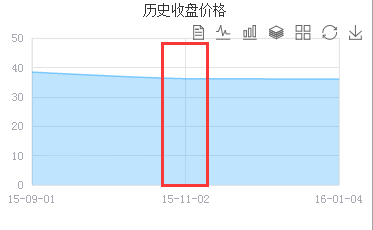
(3)设置折线图的 “x轴的、y轴” 数值区域
{type: 'value',max: 80,//区域最大值,同时还可设置[0,'100%'],来自适应最大值interval:20,//每隔区域20axisLabel:{textStyle:{color:"#a7aab3"//x轴,y轴的数字颜色,如图1}},axisLine:{//x轴、y轴的深色轴线,如图2show: true,lineStyle:{color:"red",}},axisTick:{//图3所示show: false,}}
图1: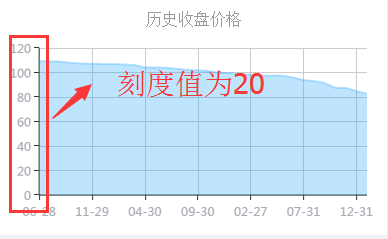
图2: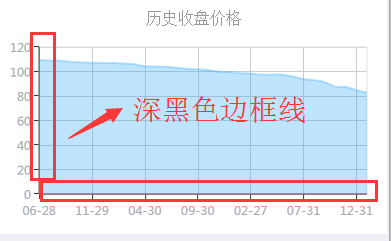
图3: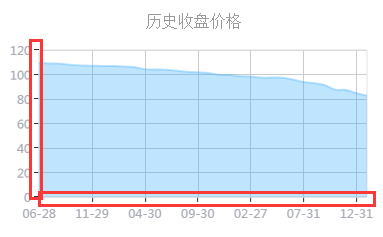
(4)网格边框线(y轴内绘边框线)
splitLine: {//终于找到了,背景图的内置表格中“边框”的颜色线条 这个是x跟y轴轴的线show: true,lineStyle:{color:"#e4e4e4",type:"solid"}}
如下图所示:
网格边框线(x轴内绘边框线)
(5)x轴跟y轴的颜色及其字体
axisLabel:{show:true,textStyle:{fontSize:"8px",color:"red",align:"center"},formatter:function(e){return e;}}
如图所示: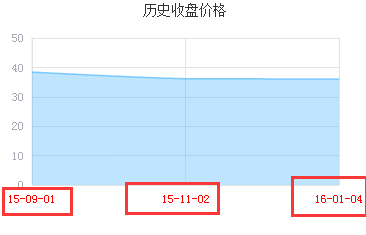
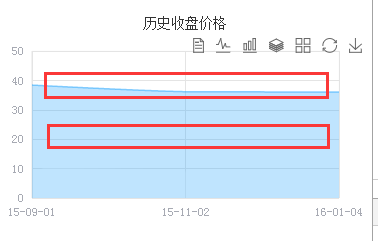
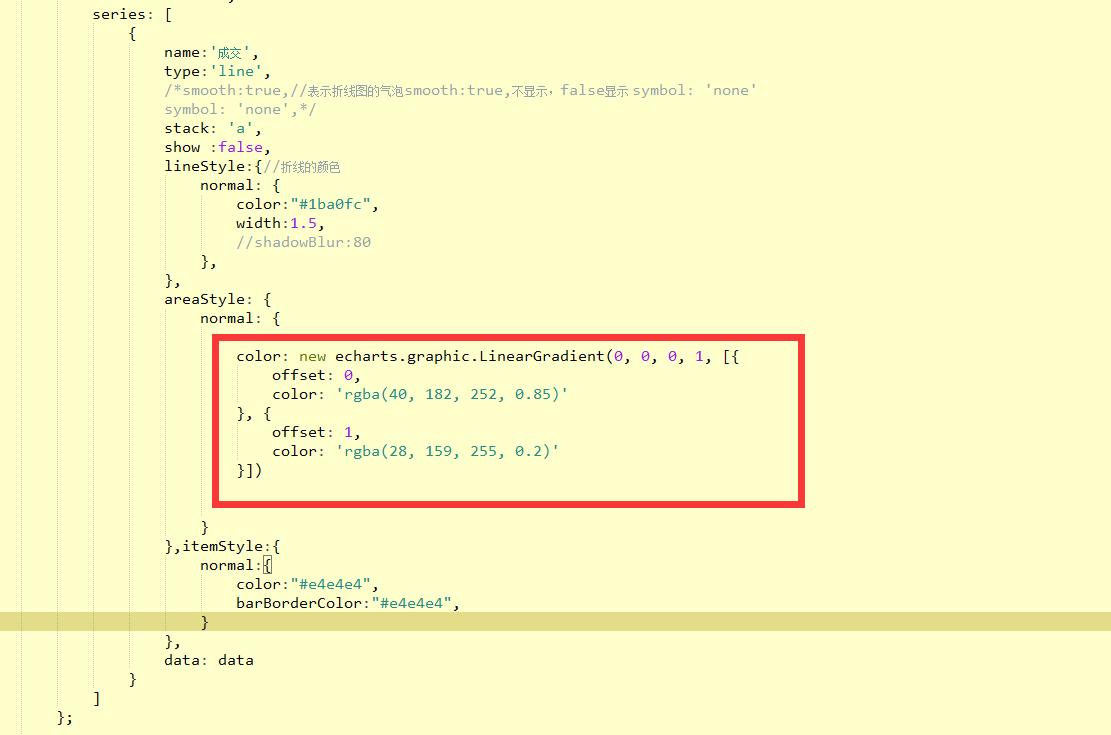
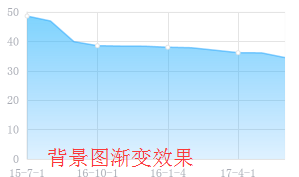
(6)轴体颜色渐变效果
normal: {color: new echarts.graphic.LinearGradient(0, 0, 0, 1, [{ offset: 0, color: 'rgba(40, 182, 252, 0.85)' }, { offset: 1, color: 'rgba(28, 159, 255, 0.2)' }]) }
效果图:
最后效果代码附上:
option = {tooltip : {trigger: 'axis'},title: {x: 'center',text: '',},legend: {top: 'bottom',data:['意向'],},grid:{x:10,y:20,x2:30,y2:20,show:true,borderColor:"#e4e4e4",//网格边框线shadowColor:"#e4e4e4",borderWidth:"0.2",containLabel:true,},toolbox: {show: true,feature: {mark: {show: true},dataView: {show: true, readOnly: false},magicType: {show: true, type: ['line', 'bar', 'stack', 'tiled']},restore: {show: true},saveAsImage: {show: true}}},xAxis: [{type: 'category',splitNumber:6,boundaryGap: false,data: date,axisLabel:{textStyle:{color:"#a7aab3"}},axisLine:{//x轴的横坐标边框线show: false},axisTick:{show: false,},axisLabel:{show:true,textStyle:{fontSize:"8px",color:"#a7aab3",align:"center"},formatter:function(e){return e;}},splitLine: {//终于找到了,背景图的内置表格中“边框”的颜色线条 这个是x轴的竖线show: true,lineStyle:{color:"#e4e4e4",type:"solid"}}}],yAxis: [{type: 'value',max: yAxisMax,splitNumber:5,interval:interval,axisLabel:{textStyle:{color:"#a7aab3"},},axisLine:{show: true,lineStyle:{color:"#e4e4e4"}},axisTick:{show: false,},axisLabel:{show:true,textStyle:{fontSize:"8px",color:"#a7aab3"}},splitLine: {//终于找到了,背景图的内置表格中“边框”的颜色线条 这个是y轴的横线show: true,lineStyle:{color:"#e4e4e4",type:"solid",}}}],dataZoom: {type: 'inside',start: 23,end: 100,},lineStyle: {normal: {type: 'solid',color:"#28a5fc",opacity :"0.5"}},backgroundColor:"#FFFFFF",//背景颜色borderWidth:0.1,series: [{name:'成交',type:'line',/*smooth:true,//true,表示曲线,false,表示折线 symbol: 'none',//是否显示折线图气泡*/stack: 'a',show :false,lineStyle:{//折线的颜色normal: {color:"#1ba0fc",width:1.5,//shadowBlur:80},},areaStyle: {normal: {color: new echarts.graphic.LinearGradient(0, 0, 0, 1, [{offset: 0,color: 'rgba(40, 182, 252, 0.85)'}, {offset: 1,color: 'rgba(28, 159, 255, 0.2)'}])}},itemStyle:{normal:{color:"#e4e4e4",barBorderColor:"#e4e4e4",}},data: data}]};

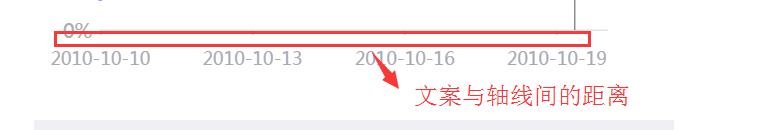
(7)文案与轴线的距离
xAxis: [{axisLabel: {textStyle: {color: "#a7aab3",fontSize: "18",},margin: 16,//刻度标签与轴线之间的距离。}}],
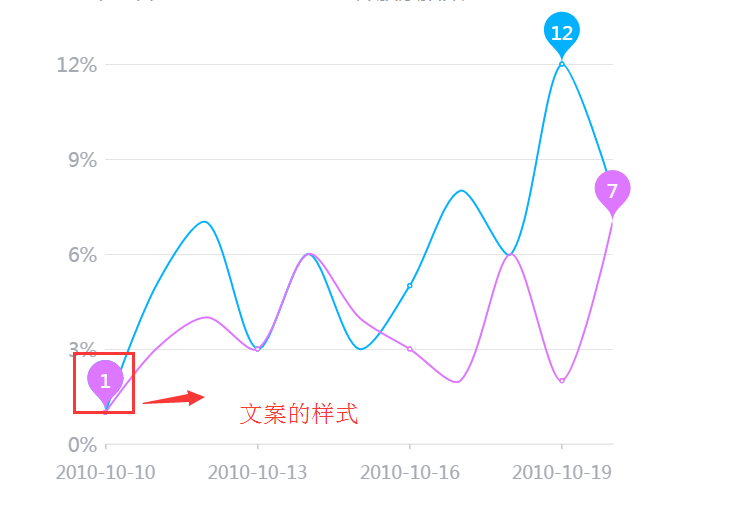
(8)文案与轴线的距离
markPoint: {symbolSize:60,//标记的大小label:{normal:{textStyle:{fontSize: 19,//文字的大小}}}}
二、饼图的配置
(9)饼图字体大小修改 fontSize
series: [{name: '比例',type: 'pie',radius: '55%',center: ['50%', '60%'],label: {normal: {formatter: '{b}:{c}: ({d}%)',textStyle: {fontWeight: 'normal',fontSize: 15}}}}]


盒子模型,边框,内外边距,盒子模型布局,ps基本操作,列表样式,圆角边框,盒子阴影")


还没有评论,来说两句吧...