Python金融大数据分析——第5章 数据可视化 笔记
文章目录
- 5.1.3 其他绘图样式
- 5.2 金融学图表
#第5章 数据可视化
##5.1 二维绘图
###5.1.1 一维数据集
按照给定的x和y值绘图
import matplotlib as mplimport matplotlib.pyplot as plt%matplotlib inline # 如果是在控制台上执行代码,这行如果报错,下面的图片显示一张,关闭后再执行下一张的显示,不然都会画到一张图上np.random.seed(1000)# 生成20个标准正态分布(伪)随机数, 保存在一个NumPy ndarray中y = np.random.standard_normal(20)x = range(len(y))plt.plot(x, y)plt.title('5-1 按照给定的x和y值绘图')
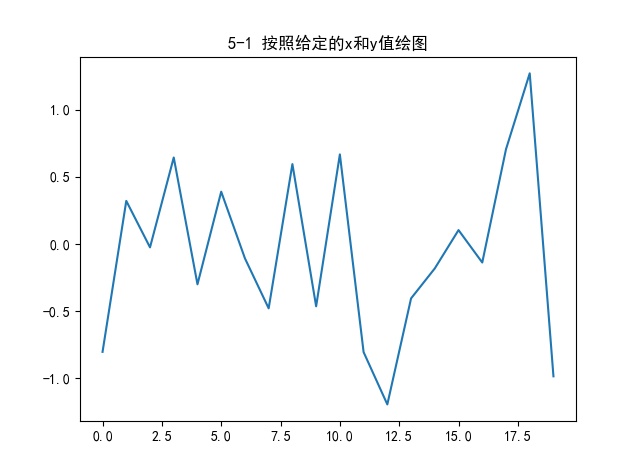
按照给定的一维数组和附加方法绘图
# 按照给定的一维数组和附加方法绘图plt.plot(y)plt.title('5-2 按照一维数组给出的数据绘图')
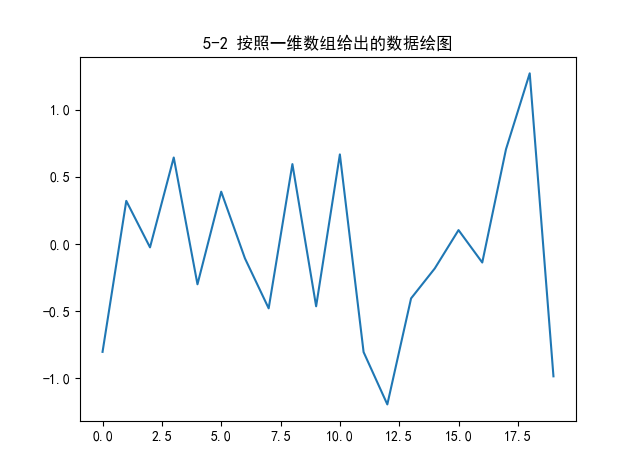
按照给定的一维数组和附加方法绘图
# 按照给定的一维数组和附加方法绘图plt.plot(y.cumsum())plt.title('5-3 按照给定的一维数组和附加方法绘图')
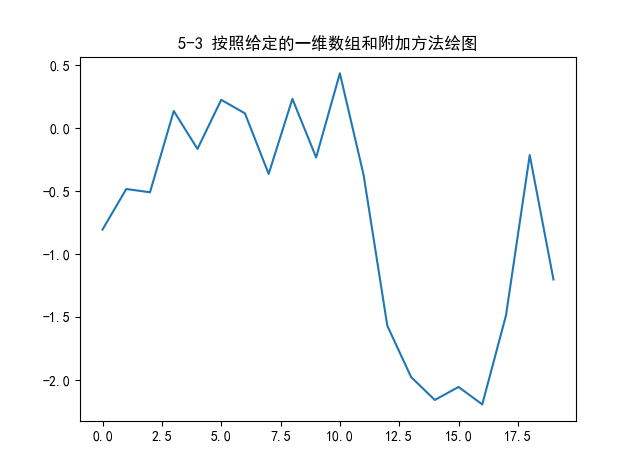
带有网络和紧凑坐标轴的图表
# 带有网络和紧凑坐标轴的图表plt.plot(y.cumsum())plt.grid(True)plt.axis('tight')plt.title('5-4 带有网络和紧凑坐标轴的图表')
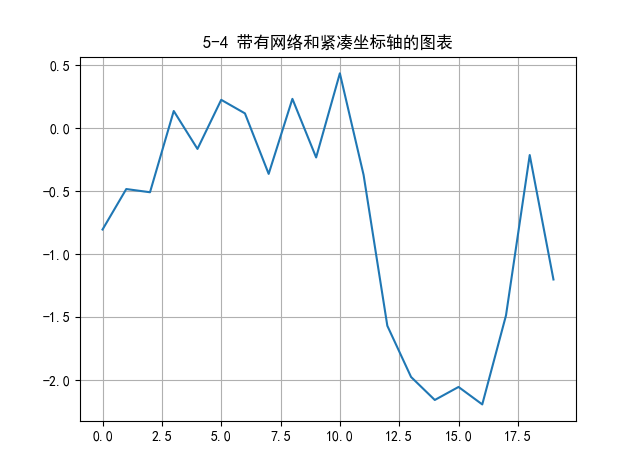
plt.axis选项
| 参数 | 描述 |
|---|---|
| Empty | 返回当前坐标轴限值 |
| off | 关闭坐标轴和标签 |
| equat | 使用等刻度 |
| scaled | 通过尺寸变化平衡度量 |
| tight | 所有数据可见(缩小限值) |
| image | 是所有数据可见(使用数据限值) |
| [xmin,xmax,ymin,ymax] | 将设置限值为给定的一组值 |
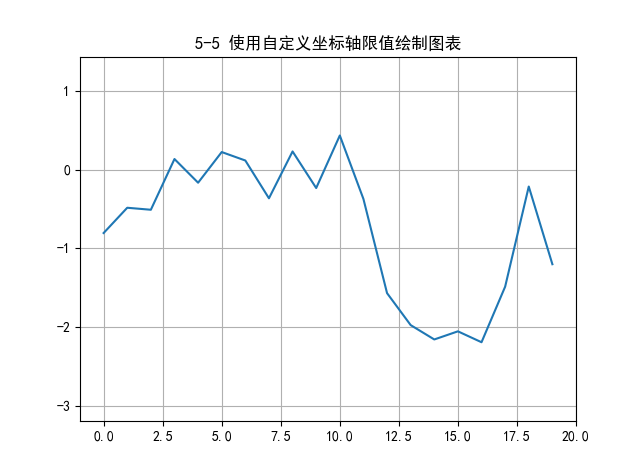
使用自定义坐标轴限值绘制图表
# 使用自定义坐标轴限值绘制图表plt.plot(y.cumsum())plt.grid(True)plt.xlim(-1, 20)plt.ylim(np.min(y.cumsum()) - 1, np.max(y.cumsum()) + 1)plt.title('5-5 使用自定义坐标轴限值绘制图表')
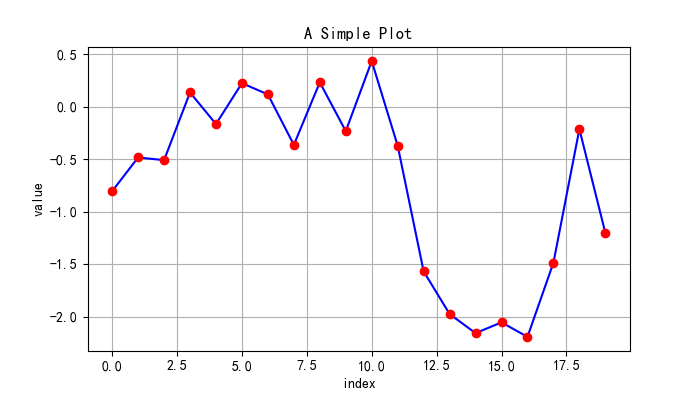
带有典型标签的图表
# 带有典型标签的图表plt.figure(figsize=(7, 4))# the figsize parameter defines the size of the figure in (width,height)plt.plot(y.cumsum(),'b',lw=1.5)plt.plot(y.cumsum(),'ro')plt.grid(True)plt.axis('tight')plt.xlabel('index')plt.ylabel('value')plt.title('A Simple Plot')
标准颜色缩写
| 字符 | 颜色 |
|---|---|
| b | 蓝 |
| g | 绿 |
| r | 红 |
| c | 青 |
| m | 品红 |
| y | 黄 |
| k | 黑 |
| w | 白 |
标准样式字符
| 字符 | 象征 |
|---|---|
| - | 实现样式 |
| – | 短划线样式 |
| -. | 点实线样式 |
| : | 虚线样式 |
| . | 点标记 |
| , | 像素标记 |
| o | 圆标记 |
| v | 向下三角形标记 |
| ^ | 向上三角形标记 |
| < | 向左三角形标记 |
| > | 向右三角形标记 |
| 1 | Tri_down标记 |
| 2 | Tri_up标记 |
| 3 | Tri_left标记 |
| 4 | Tri_right标记 |
| s | 方形标记 |
| P | 五边形标记 |
| * | 星号 |
| h | 六角形标记1 |
| H | 六角形标记2 |
| + | 加好 |
| x | X标记 |
| D | 菱形标记 |
| d | 细菱形标记 |
| | | 垂直标记 |
###5.1.2 二维数据集
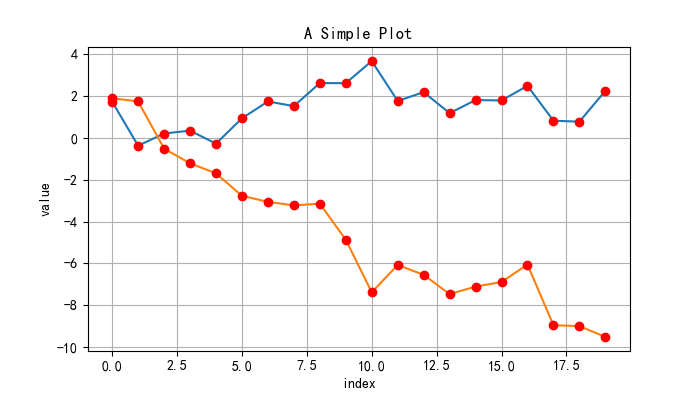
用两个数据集绘制图表
# 用两个数据集绘制图表np.random.seed(2000)y = np.random.standard_normal((20, 2)).cumsum(axis=0)plt.figure(figsize=(7, 4))plt.plot(y, lw=1.5)plt.plot(y, 'ro')plt.grid(True)plt.axis('tight')plt.xlabel('index')plt.ylabel('value')plt.title('A Simple Plot')
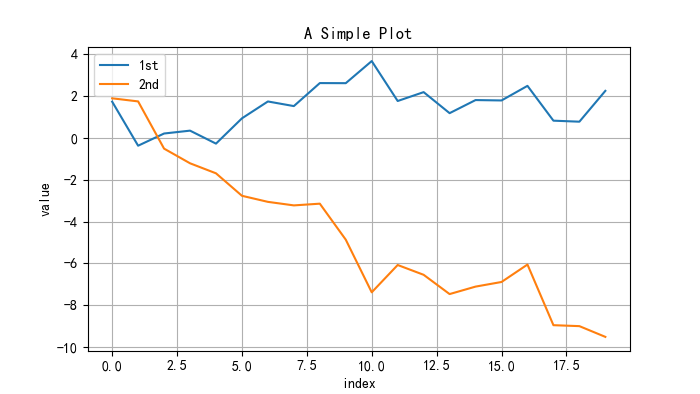
带有数据集的图表
# 带有数据集的图表plt.figure(figsize=(7, 4))plt.plot(y[:, 0], lw=1.5, label='1st')plt.plot(y[:, 1], lw=1.5, label='2nd')plt.grid(True)plt.legend(loc=0)plt.axis('tight')plt.xlabel('index')plt.ylabel('value')plt.title('A Simple Plot')
plt.legend选项
| 位置选项 | 描述 |
|---|---|
| 空白 | 自动 |
| 0 | 最佳 |
| 1 | 右上 |
| 2 | 左上 |
| 3 | 左下 |
| 4 | 右下 |
| 5 | 右 |
| 6 | 中左 |
| 7 | 中右 |
| 8 | 中下 |
| 9 | 中上 |
| 10 | 中 |
包含两个数据集、 两个y轴的图表
# 包含两个数据集、 两个y轴的图表y[:, 0] = y[:, 0] * 10fig, ax1 = plt.subplots()plt.plot(y[:, 0], 'b', lw=1.5, label='1st')plt.plot(y[:, 0], 'ro')plt.grid(True)plt.legend(loc=8)plt.axis('tight')plt.xlabel('index')plt.ylabel('value 1st')plt.title('A Simple Plot')ax2 = ax1.twinx()plt.plot(y[:, 1], 'g', lw=1.5, label='2nd')plt.legend(loc=0)plt.ylabel('value 2nd')
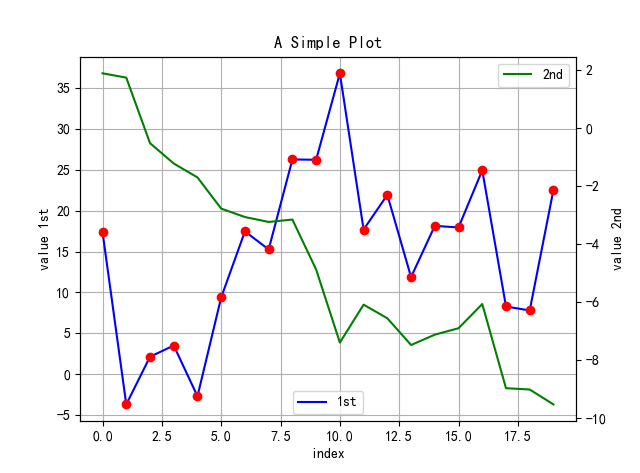
带有两个子图的图表
# 带有两个子图的图表plt.figure(figsize=(7, 5))plt.subplot(211)plt.plot(y[:, 0], 'b', lw=1.5, label='1st')plt.plot(y[:, 0], 'ro')plt.grid(True)plt.legend(loc=0)plt.axis('tight')plt.ylabel('value')plt.title('A Simple Plot')plt.subplot(212)plt.plot(y[:, 0], 'g', lw=1.5, label='2nd')plt.plot(y[:, 0], 'ro')plt.grid(True)plt.legend(loc=0)plt.axis('tight')plt.xlabel('index')plt.ylabel('value')
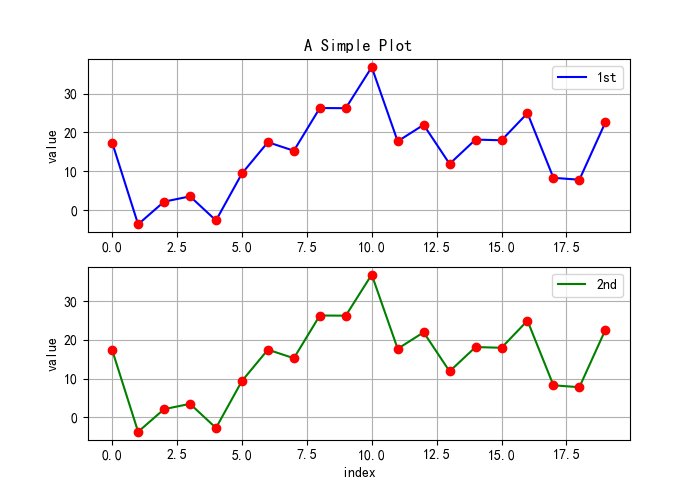
组合线、点子图和柱状子图
# 组合线、点子图和柱状子图plt.figure(figsize=(9, 4))plt.subplot(121)plt.plot(y[:, 0], lw=1.5, label='1st')plt.plot(y[:, 0], 'ro')plt.grid(True)plt.legend(loc=0)plt.axis('tight')plt.xlabel('index')plt.ylabel('value')plt.title('1st Data Set')plt.subplot(122)plt.bar(np.arange(len(y)), y[:, 1], width=0.5, color='g', label='2nd')plt.grid(True)plt.legend(loc=0)plt.axis('tight')plt.xlabel('index')plt.title('2nd Data Set')
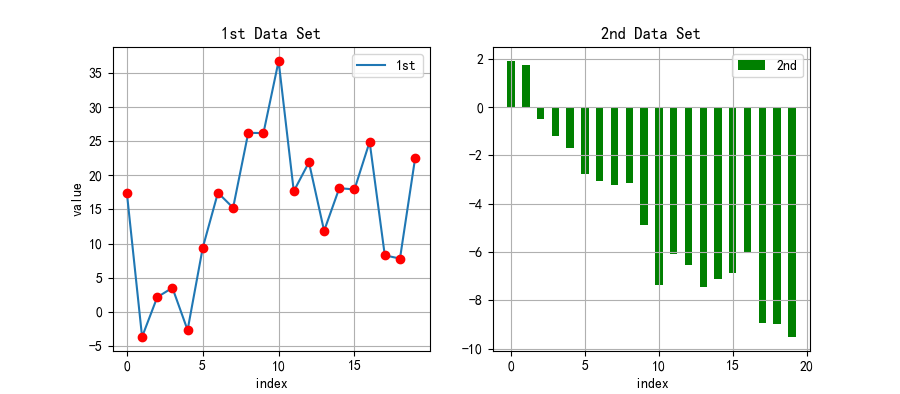
5.1.3 其他绘图样式
通过plot函数绘制散点图
# 通过plot函数绘制散点图y = np.random.standard_normal((1000, 2))plt.figure(figsize=(7, 5))plt.plot(y[:, 0], y[:, 1], 'ro')plt.grid(True)plt.xlabel('1st')plt.ylabel('2nd')plt.title('Scatter Plot')
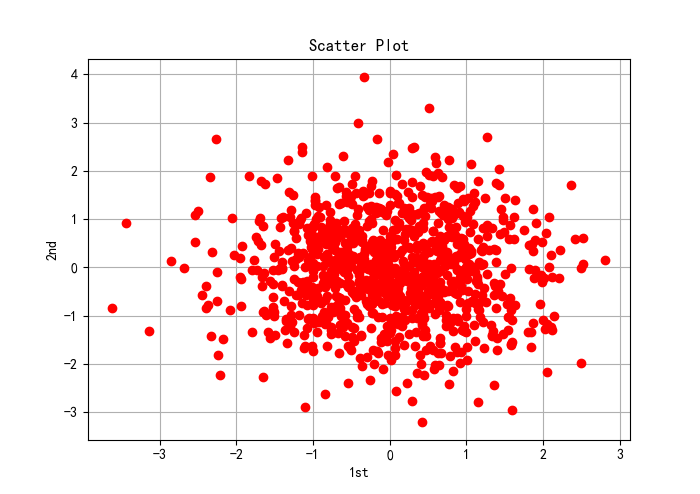
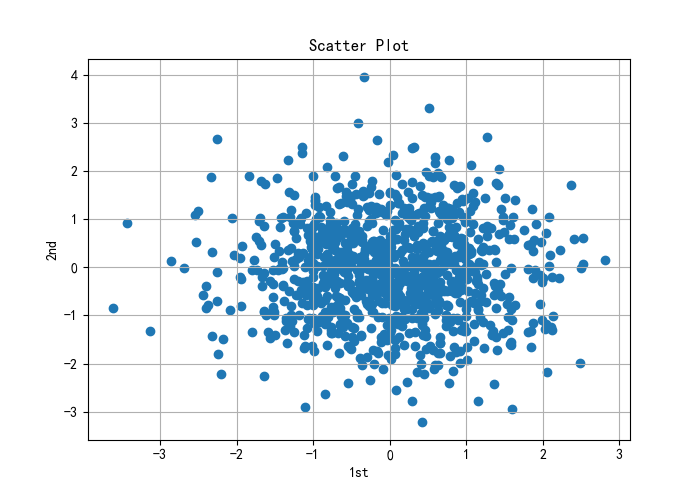
通过scatter函数绘制散点图
# 通过scatter函数绘制散点图plt.figure(figsize=(7, 5))plt.scatter(y[:, 0], y[:, 1], marker='o')plt.grid(True)plt.xlabel('1st')plt.ylabel('2nd')plt.title('Scatter Plot')
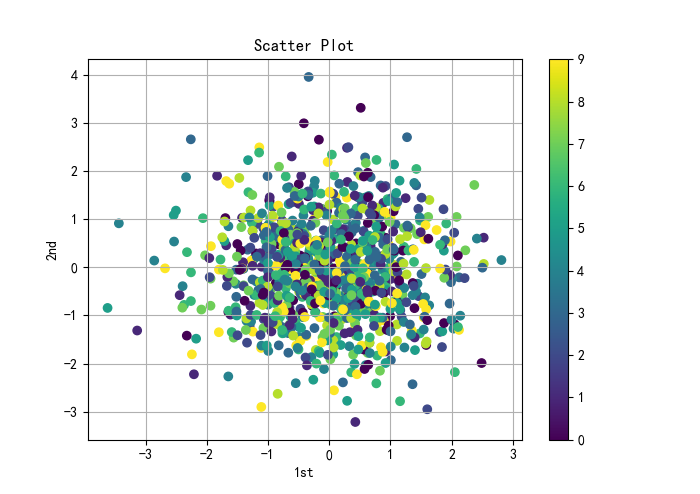
# 具备第三维的散点图c = np.random.randint(0, 10, len(y))plt.figure(figsize=(7, 5))plt.scatter(y[:, 0], y[:, 1], c=c, marker='o')plt.colorbar()plt.grid(True)plt.xlabel('1st')plt.ylabel('2nd')plt.title('Scatter Plot')
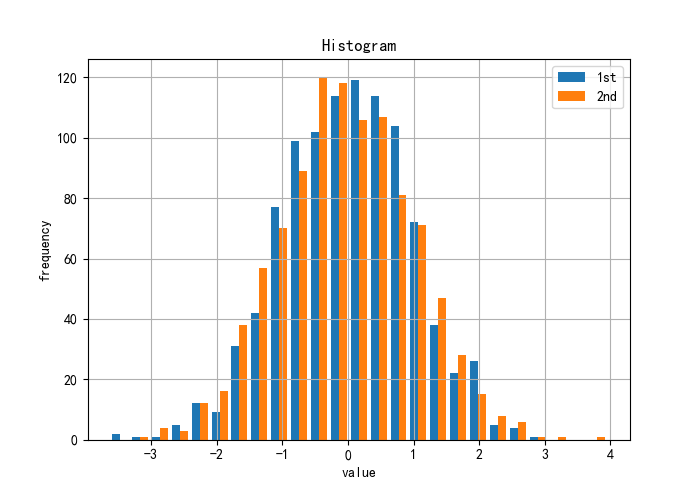
两个数据集的直方图
# 两个数据集的直方图plt.figure(figsize=(7, 5))plt.hist(y, label=['1st', '2nd'], bins=25)plt.grid(True)plt.legend(loc=0)plt.xlabel('value')plt.ylabel('frequency')plt.title('Histogram')
plt.hist所支持的参数:
plt.hist(x, bins=None, range=None, normed=False, weights=None, cumulative=False, bottom=None, histtype=‘bar’, align=‘mid’, orientation=‘vertical’, rwidth=None, log=False, color=None, label=None, stacked=False, hold=None, data=None, **kwargs)
plt.hist参数
| 参数 | 描述 |
|---|---|
| x | 列表对象,ndarray对象 |
| bins | 数据组(bin)数 |
| range | 数据组的上界和下界 |
| normed | 规范化为整数 |
| weights | x轴上每个值的权重 |
| cumulative | 每个数据组包含较低组别的计数 |
| histtype | 选项(字符串): bar, barstacked, step, stepfilled |
| align | 选项(字符串): lef, mid, right |
| orientation | 选项(字符串): horizontal, vertical |
| rwidth | 条块的相对宽度 |
| log | 对数刻度 |
| color | 每个数据集的颜色(类似数组) |
| label | 标签所用的字符席或者字符串序列 |
| stacked | 堆叠多个数据集 |
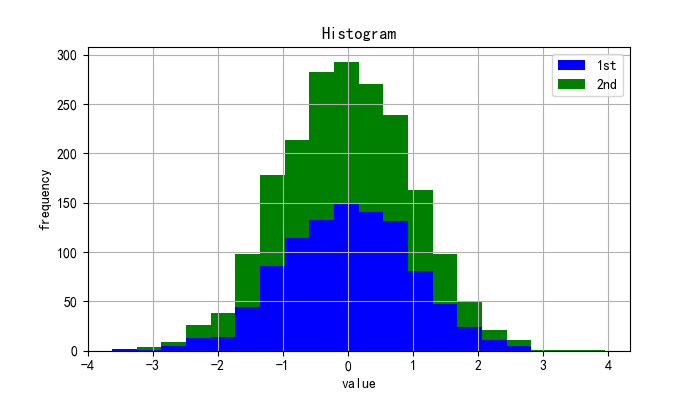
两个数据集堆叠的直方图
# 两个数据集堆叠的直方图plt.figure(figsize=(7, 4))plt.hist(y, label=['1st', '2nd'], color=['b', 'g'], stacked=True, bins=20)plt.grid(True)plt.legend(loc=0)plt.xlabel('value')plt.ylabel('frequency')plt.title('Histogram')
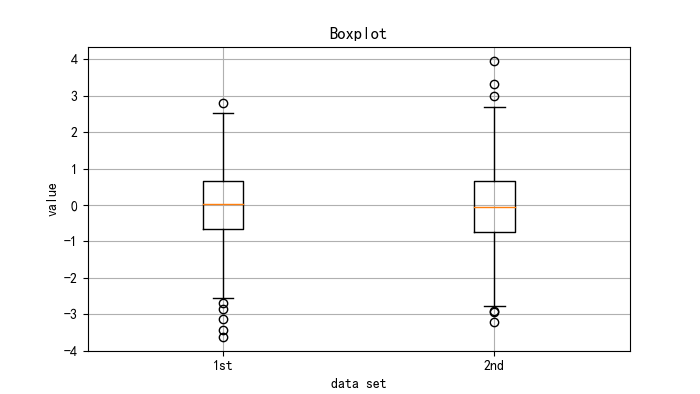
两个数据集的箱形图
# 两个数据集的箱形图fig, ax = plt.subplots(figsize=(7, 4))plt.boxplot(y)plt.grid(True)plt.setp(ax, xticklabels=['1st', '2nd'])plt.xlabel('data set')plt.ylabel('value')plt.title('Boxplot')
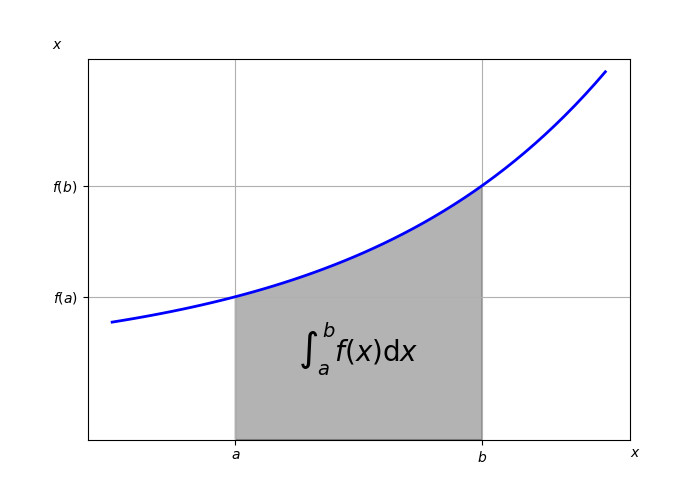
指数函数、积分面积和LaTeX标签
# 指数函数、积分面积和LaTeX标签from matplotlib.patches import Polygondef func(x):return 0.5 * np.exp(x) + 1a, b = 0.5, 1.5x = np.linspace(0, 2)y = func(x)fig, ax = plt.subplots(figsize=(7, 5))plt.plot(x, y, 'b', linewidth=2)plt.ylim(ymin=0)Ix = np.linspace(a, b)Iy = func(Ix)verts = [(a, 0)] + list(zip(Ix, Iy)) + [(b, 0)]poly = Polygon(verts, facecolor='0.7', edgecolor='0.5')ax.add_patch(poly)plt.text(0.5 * (a + b), 1, r"$\int_a^b f(x)\mathrm{d}x$", horizontalalignment='center', fontsize=20)plt.figtext(0.9, 0.075, '$x$')plt.figtext(0.075, 0.9, '$x$')ax.set_xticks((a, b))ax.set_xticklabels(('$a$', '$b$'))ax.set_yticks([func(a), func(b)])ax.set_yticklabels(('$f(a)$', '$f(b)$'))plt.grid(True)
5.2 金融学图表
金融数据的蜡烛图
"""# import matplotlib.finance as mpf # 这个方法过期了# MatplotlibDeprecationWarning: The finance module has been deprecated in mpl 2.0 and will be removed in mpl 2.2. Please use the module mpl_finance instead. warnings.warn(message, mplDeprecation, stacklevel=1)# 要用下面的方法 import mpl_finance as mpf# 安装方法: >pip install https://github.com/matplotlib/mpl_finance/archive/master.zip"""import mpl_finance as mpf# start = (2014, 5, 1)# end = (2014, 6, 30)# quotes = mpf._quotes_historical_yahoo('GDAXI', start, end)# 由于伟大的墙,调取不到国外的数据,这里用tushare获取600118中国卫星的数据import tushare as tsimport datetimefrom matplotlib.pylab import date2numstart = '2018-05-01'end = '2018-06-30'k_d = ts.get_k_data('600118', start, end, ktype='D')k_d.head()k_d.date = k_d.date.map(lambda x: date2num(datetime.datetime.strptime(x, '%Y-%m-%d')))quotes = k_d.valuesfig, ax = plt.subplots(figsize=(8, 5))fig.subplots_adjust(bottom=0.2)mpf.candlestick_ochl(ax, quotes, width=0.6, colorup='r', colordown='g', alpha=0.8)plt.grid(True)ax.xaxis_date()# dates on the x-axisax.autoscale_view()plt.setp(plt.gca().get_xticklabels(), rotation=30)
k_d.head()输入的结果:
| date | open | close | high | low | volume | code | |
|---|---|---|---|---|---|---|---|
| 77 | 2018-05-02 | 23.05 | 22.45 | 23.10 | 22.25 | 90673.0 | 600118 |
| 78 | 2018-05-03 | 22.30 | 22.52 | 22.58 | 21.71 | 78948.0 | 600118 |
| 79 | 2018-05-04 | 22.50 | 22.35 | 22.58 | 22.21 | 58511.0 | 600118 |
| 80 | 2018-05-07 | 22.49 | 22.70 | 22.71 | 22.30 | 58248.0 | 600118 |
| 81 | 2018-05-08 | 22.80 | 23.07 | 23.45 | 22.75 | 115629.0 | 600118 |
最后的图片: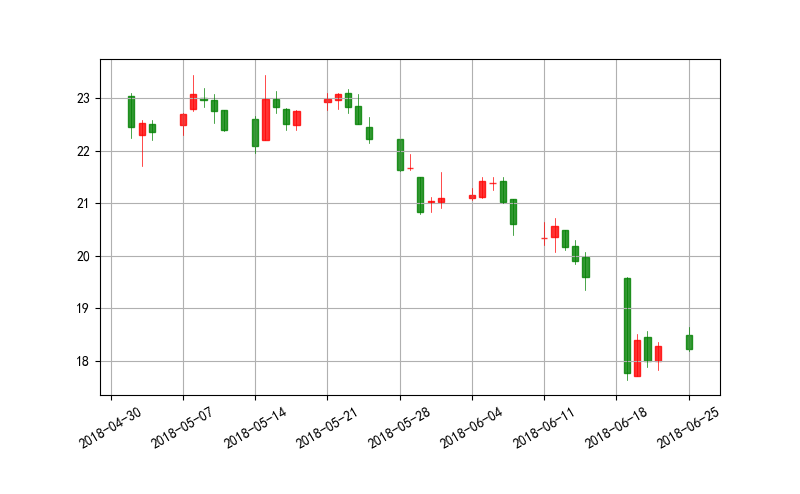
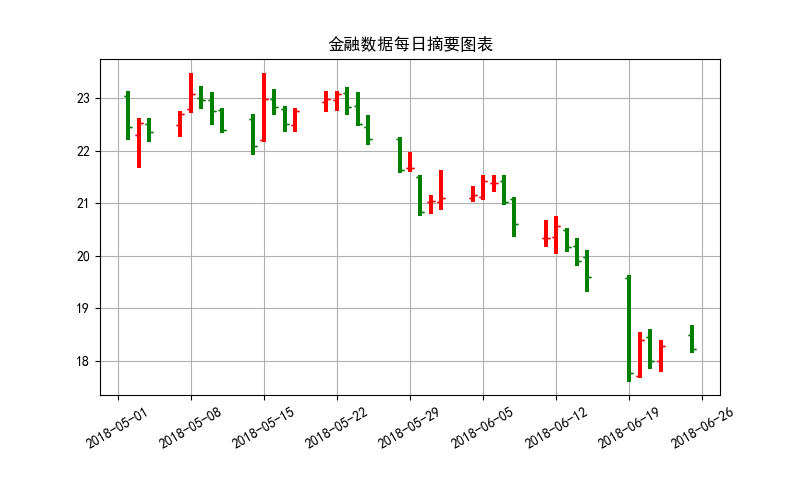
金融数据每日摘要图表
# 金融数据每日摘要图表fig, ax = plt.subplots(figsize=(8, 5))fig.subplots_adjust(bottom=0.2)mpf._plot_day_summary(ax, quotes, colorup='r', colordown='g')plt.grid(True)ax.xaxis_date()# dates on the x-axisax.autoscale_view()plt.setp(plt.gca().get_xticklabels(), rotation=30)plt.title('金融数据每日摘要图表')
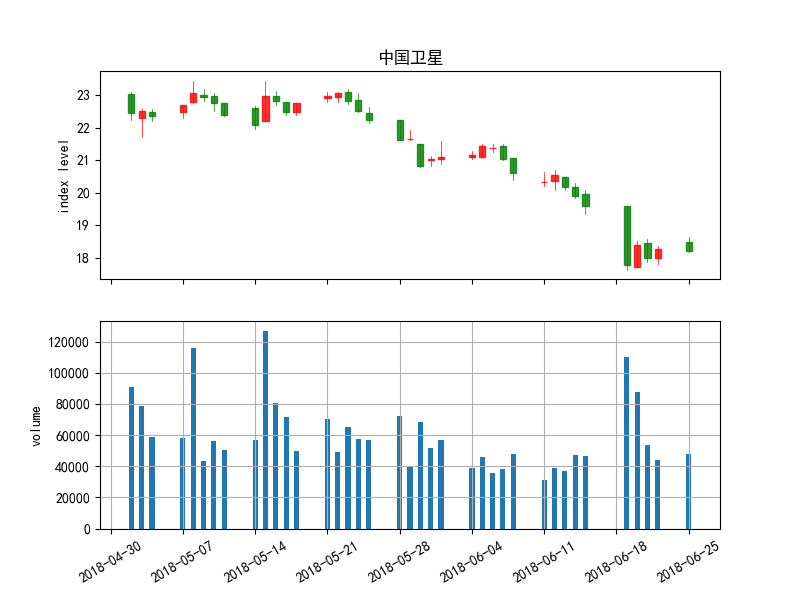
蜡烛图和成交量柱状图组合而成的图表
# 蜡烛图和成交量柱状图组合而成的图表fig, (ax1, ax2) = plt.subplots(2, sharex=True, figsize=(8, 6))mpf.candlestick_ochl(ax1, quotes, width=0.6, colorup='r', colordown='g', alpha=0.8)ax1.set_title('中国卫星')ax1.set_ylabel('index level')plt.grid(True)ax1.xaxis_date()plt.bar(quotes[:,0],quotes[:,5],width=0.5)ax2.set_ylabel('volume')ax2.grid(True)plt.setp(plt.gca().get_xticklabels(), rotation=30)
##5.3 3D绘图
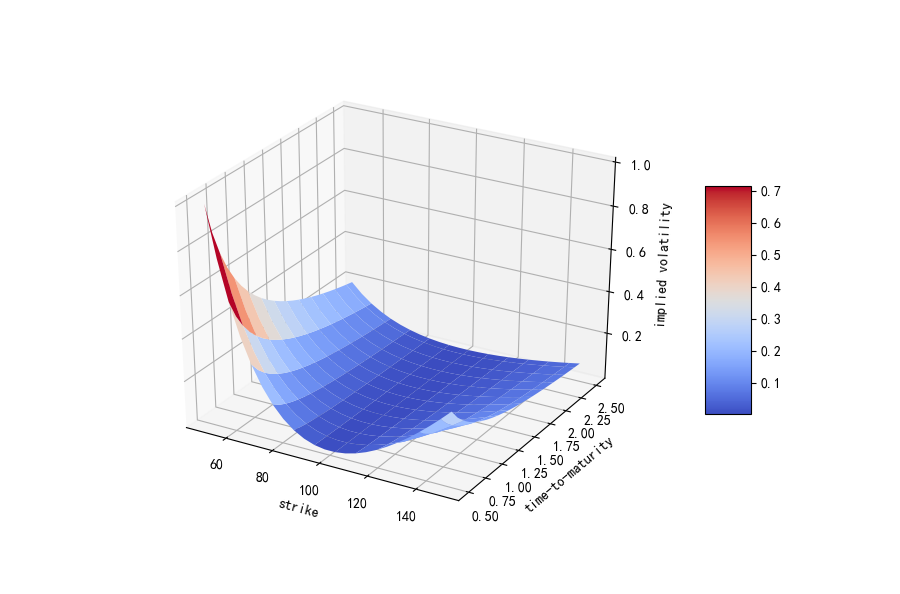
(模拟)隐含波动率的 3D 曲面图
#strike = np.linspace(50, 150, 24)ttm = np.linspace(0.5, 2.5, 24)strike, ttm = np.meshgrid(strike, ttm)iv = (strike - 100) ** 2 / (100 * strike) / ttm# generate fake implied volatilitiesfrom mpl_toolkits.mplot3d import Axes3Dfig = plt.figure(figsize=(9, 6))ax = fig.gca(projection='3d')surf = ax.plot_surface(strike, ttm, iv, rstride=2, cstride=2, cmap=plt.cm.coolwarm, linewidth=0.5, antialiased=True)ax.set_xlabel('strike')ax.set_ylabel('time-to-maturity')ax.set_zlabel('implied volatility')fig.colorbar(surf, shrink=0.5, aspect=5)
plot_surface参数
| 参数 | 描述 |
|---|---|
| X,Y,Z | 2D数组形式的数据值 |
| rstride | 数组行距(步长大小) |
| cstride | 数组列距(步长大小) |
| color | 曲面块颜色 |
| cmap | 曲面块颜色映射 |
| facecolors | 单独曲面块表面颜色 |
| norm | 将值映射为颜色的 Nonnalize实例 |
| vmin | 映射的最小值 |
| vmax | 映射的最大值 |
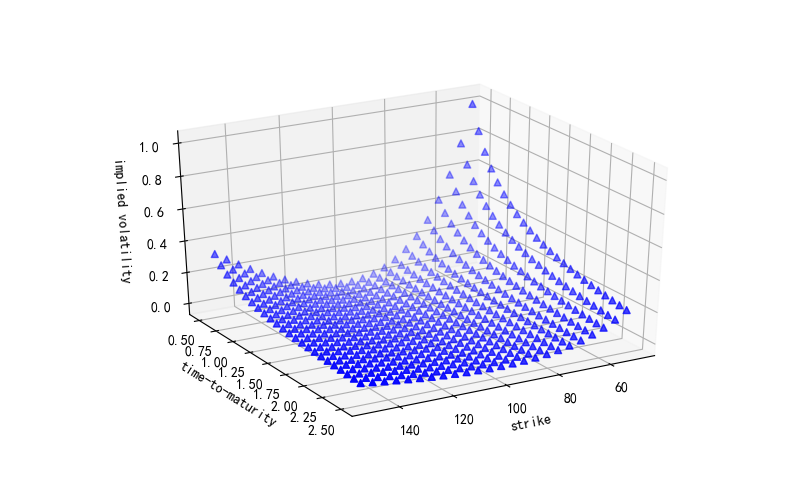
(模拟)隐含波动率的 3D 散点图
#(模拟)隐含波动率的 3D 散点图fig = plt.figure(figsize=(8, 5))ax = fig.add_subplot(111,projection='3d')ax.view_init(30,60)ax.scatter(strike, ttm, iv, zdir='z',s=25,c='b',marker='^')ax.set_xlabel('strike')ax.set_ylabel('time-to-maturity')ax.set_zlabel('implied volatility')
end


![[NLP]高级词向量之OpenAI GPT详解 [NLP]高级词向量之OpenAI GPT详解](https://image.dandelioncloud.cn/images/20230528/ac953c57e9a740979ff7b35454f126b6.png)


还没有评论,来说两句吧...