Python计算机视觉编程(二)---SIFT、Harris特征
图像局部描述符
本文工作
Harris
- 角点检测
- 在图像间寻找对应点
SIFT
- 检测关键点
- 描述子匹配
- 地理标记图像匹配
工具包的安装
- vlfeat
- Graphviz
- pydot
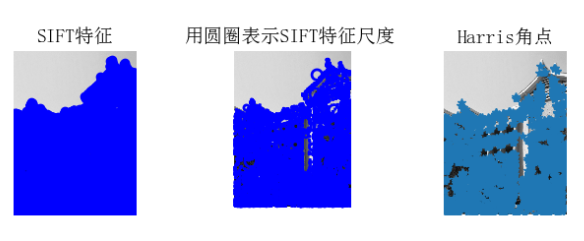
检测感兴趣点
对比Harris和SIFT,将Harris角点检测的显示在了图像的最后,这两种算法选择了不同的坐标。
# -*- coding: utf-8 -*-from PIL import Imagefrom pylab import *from PCV.localdescriptors import siftfrom PCV.localdescriptors import harris# 添加中文字体支持from matplotlib.font_manager import FontPropertiesfont = FontProperties(fname=r"c:\windows\fonts\SimSun.ttc", size=14)imname = 'E:\\study_work\\python\\images\\school4.jpg'im = array(Image.open(imname).convert('L'))sift.process_image(imname, 'school.sift')l1, d1 = sift.read_features_from_file('school.sift')figure()gray()subplot(131)sift.plot_features(im, l1, circle=False)title(u'SIFT特征',fontproperties=font)subplot(132)sift.plot_features(im, l1, circle=True)title(u'用圆圈表示SIFT特征尺度',fontproperties=font)# 检测harris角点harrisim = harris.compute_harris_response(im)subplot(133)filtered_coords = harris.get_harris_points(harrisim, 6, 0.1)imshow(im)plot([p[1] for p in filtered_coords], [p[0] for p in filtered_coords], '*')axis('off')title(u'Harris角点',fontproperties=font)show()
描述子匹配
Harris
Harris角点检测器可以给出图像中检测到兴趣点,但它并没有提供在图像间对兴趣点进行比较的方法,我们需要在每个角点添加描述子,以及对这些描述子进行比较。
# -*- coding: utf-8 -*-from pylab import *from PIL import Imagefrom PCV.localdescriptors import harrisfrom PCV.tools.imtools import imresize"""This is the Harris point matching example in Figure 2-2."""# Figure 2-2下面的图im1 = array(Image.open("E:\\study_work\\python\\images\\school11.jpg").convert("L"))im2 = array(Image.open("E:\\study_work\\python\\images\\school12.jpg").convert("L"))# resize加快匹配速度im1 = imresize(im1, (im1.shape[1]/2, im1.shape[0]/2))im2 = imresize(im2, (im2.shape[1]/2, im2.shape[0]/2))wid = 5harrisim = harris.compute_harris_response(im1, 5)filtered_coords1 = harris.get_harris_points(harrisim, wid+1)d1 = harris.get_descriptors(im1, filtered_coords1, wid)harrisim = harris.compute_harris_response(im2, 5)filtered_coords2 = harris.get_harris_points(harrisim, wid+1)d2 = harris.get_descriptors(im2, filtered_coords2, wid)print 'starting matching'matches = harris.match_twosided(d1, d2)figure()gray()harris.plot_matches(im1, im2, filtered_coords1, filtered_coords2, matches)show()
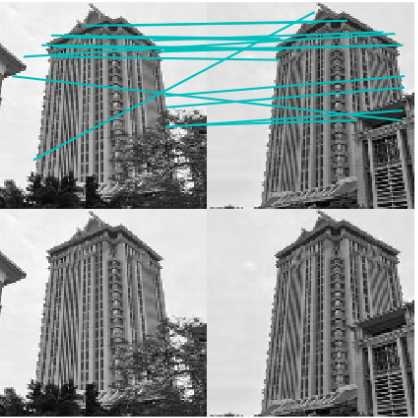
如图,可以看到结果中有许多错误的匹配,而SIFT能够较好地提高特征描述点检测与描述。
SIFT
import cv2import numpy as npdef drawMatchesKnn_cv2(img1_gray, kp1, img2_gray, kp2, goodMatch):h1, w1 = img1_gray.shape[:2]h2, w2 = img2_gray.shape[:2]vis = np.zeros((max(h1, h2), w1 + w2, 3), np.uint8)vis[:h1, :w1] = img1_grayvis[:h2, w1:w1 + w2] = img2_grayp1 = [kpp.queryIdx for kpp in goodMatch]p2 = [kpp.trainIdx for kpp in goodMatch]post1 = np.int32([kp1[pp].pt for pp in p1])post2 = np.int32([kp2[pp].pt for pp in p2]) + (w1, 0)for (x1, y1), (x2, y2) in zip(post1, post2):cv2.line(vis, (x1, y1), (x2, y2), (0, 0, 255))cv2.namedWindow("match", cv2.WINDOW_NORMAL)cv2.imshow("match", vis)img1_gray = cv2.imread("E:\\study_work\\python\\images\\school11.jpg")img2_gray = cv2.imread("E:\\study_work\\python\\images\\school12.jpg")sift = cv2.SIFT()# sift = cv2.SURF()kp1, des1 = sift.detectAndCompute(img1_gray, None)kp2, des2 = sift.detectAndCompute(img2_gray, None)# BFmatcher with default parmsbf = cv2.BFMatcher(cv2.NORM_L2)matches = bf.knnMatch(des1, des2, k=2)goodMatch = []for m, n in matches:if m.distance < 0.50 * n.distance:goodMatch.append(m)drawMatchesKnn_cv2(img1_gray, kp1, img2_gray, kp2, goodMatch[:20])cv2.waitKey(0)cv2.destroyAllWindows()
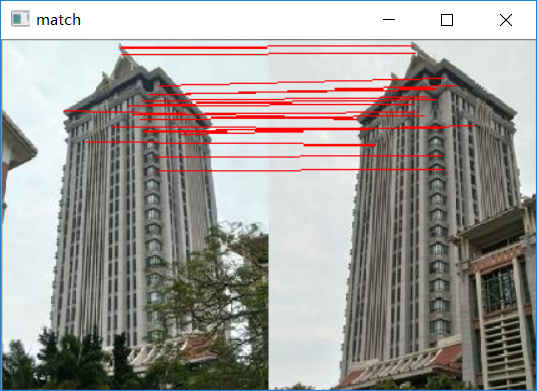
SIFT是采用opencv-python进行实践的,由结果可以看出同前面的harris对比,SIFT检测出的匹配较为精准
地理标记图像匹配
自己准备一个图像集,博主的图像集存放在E:/study_work/python/images中
此算法是用于对图像的地理位置进行匹配并描绘出关系图(注:图像一定要resize以下,不然太大,对电脑性能有影响)
# -*- coding: utf-8 -*-from pylab import *from PIL import Imagefrom PCV.localdescriptors import siftfrom PCV.tools import imtoolsimport pydot""" This is the example graph illustration of matching images from Figure 2-10.To download the images, see ch2_download_panoramio.py."""#download_path = "panoimages" # set this to the path where you downloaded the panoramio images#path = "/FULLPATH/panoimages/" # path to save thumbnails (pydot needs the full system path)download_path = "E:/study_work/python/images" # set this to the path where you downloaded the panoramio imagespath = "E:/study_work/python/images/" # path to save thumbnails (pydot needs the full system path)# list of downloaded filenamesimlist = imtools.get_imlist(download_path)nbr_images = len(imlist)# extract featuresfeatlist = [imname[:-3] + 'sift' for imname in imlist]for i, imname in enumerate(imlist):sift.process_image(imname, featlist[i])matchscores = zeros((nbr_images, nbr_images))for i in range(nbr_images):for j in range(i, nbr_images): # only compute upper triangleprint 'comparing ', imlist[i], imlist[j]l1, d1 = sift.read_features_from_file(featlist[i])l2, d2 = sift.read_features_from_file(featlist[j])matches = sift.match_twosided(d1, d2)nbr_matches = sum(matches > 0)print 'number of matches = ', nbr_matchesmatchscores[i, j] = nbr_matchesprint "The match scores is: \n", matchscores# copy valuesfor i in range(nbr_images):for j in range(i + 1, nbr_images): # no need to copy diagonalmatchscores[j, i] = matchscores[i, j]#可视化threshold = 2 # min number of matches needed to create linkg = pydot.Dot(graph_type='graph') # don't want the default directed graphfor i in range(nbr_images):for j in range(i + 1, nbr_images):if matchscores[i, j] > threshold:# first image in pairim = Image.open(imlist[i])im.thumbnail((100, 100))filename = path + str(i) + '.png'im.save(filename) # need temporary files of the right sizeg.add_node(pydot.Node(str(i), fontcolor='transparent', shape='rectangle', image=filename))# second image in pairim = Image.open(imlist[j])im.thumbnail((100, 100))filename = path + str(j) + '.png'im.save(filename) # need temporary files of the right sizeg.add_node(pydot.Node(str(j), fontcolor='transparent', shape='rectangle', image=filename))g.add_edge(pydot.Edge(str(i), str(j)))g.write_png('jimei.png')
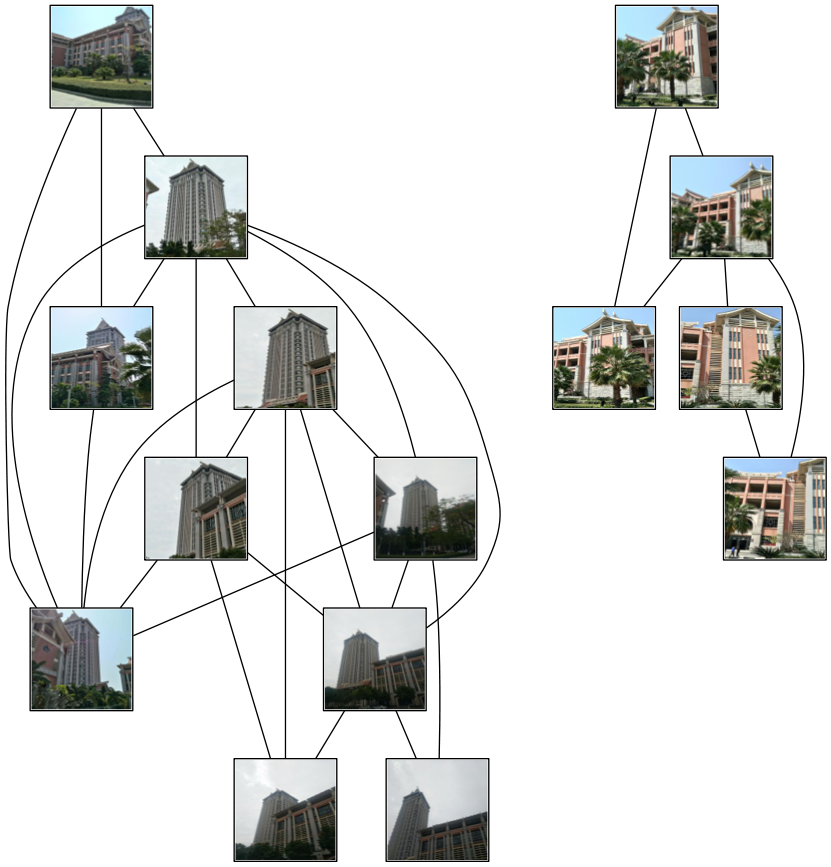
关键点匹配是采用Kd树的数据结构来完成搜索,具体原理见SIFT算法原理,如上图所示,此算法得到两组图像,由图像内容可看出匹配地理位置得出的结果还是较为准确的。
安装工具包
1、安装VLFeat
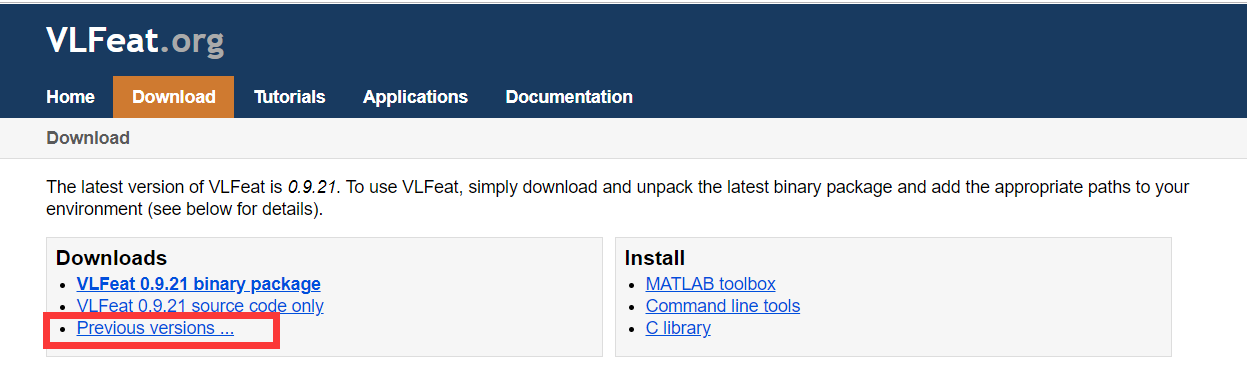
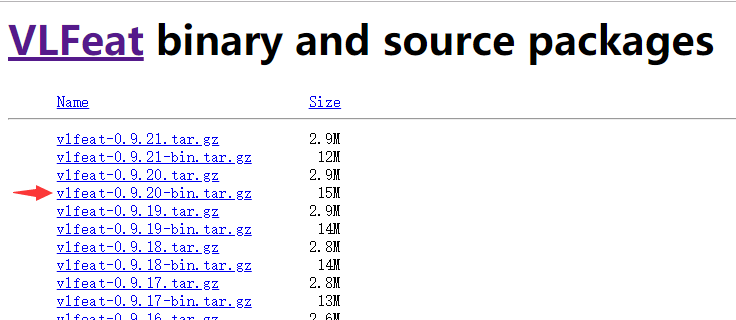
进行上述事项前,需要先安装开源工具包VLFeat,可以在www.vlfeat.org上下载,如下图所示(ps:要下载0.9.20版本,不能下载0.9.21版本的,0.9.21版本不稳定,博主已经掉过坑)
下载完之后解压(博主电脑是windows64位的,所以选择win64),复制此文件夹并将win64放进PCV所在目录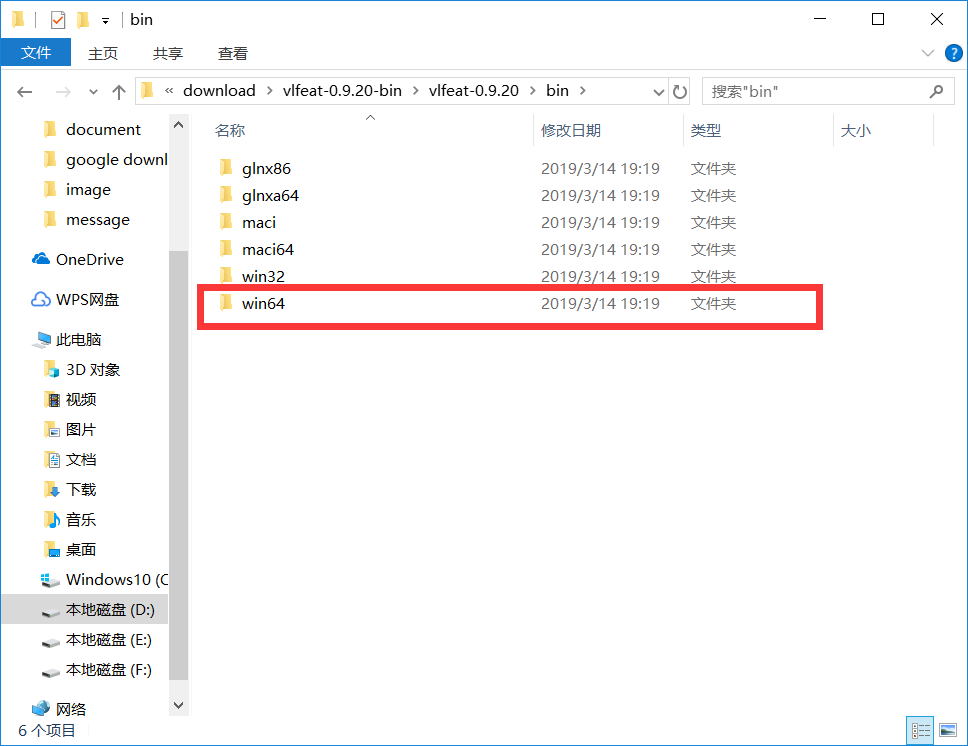
放到此目录下(这是博主的PCV所在地,你们根据自己的做相应的改变)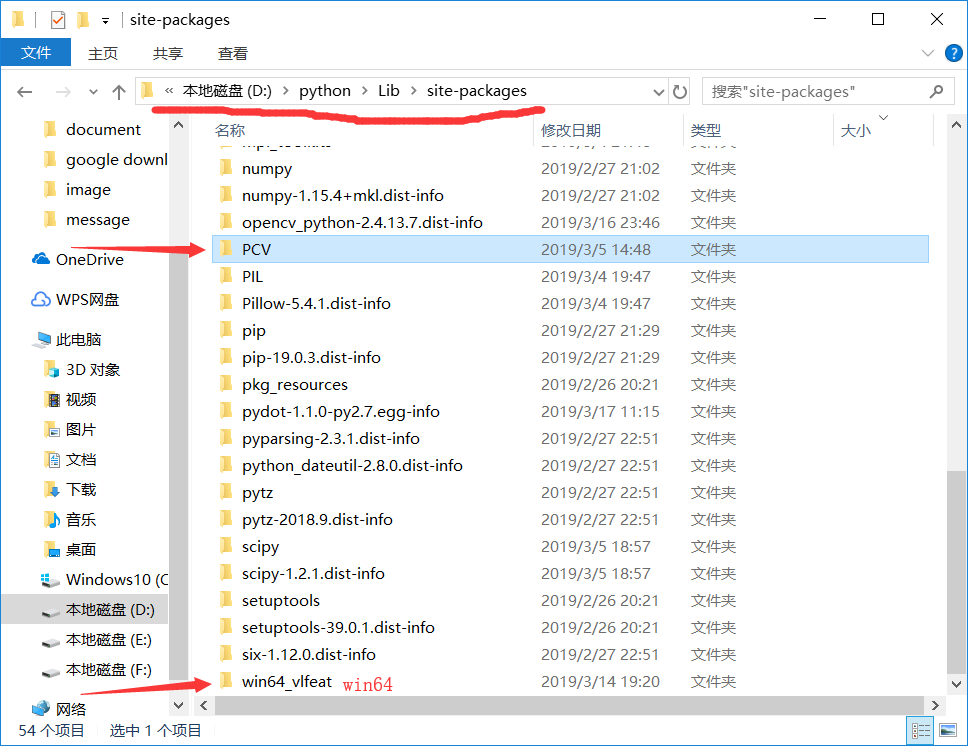
打开PCV中的localdescriptors文件夹,找到sift.py并打开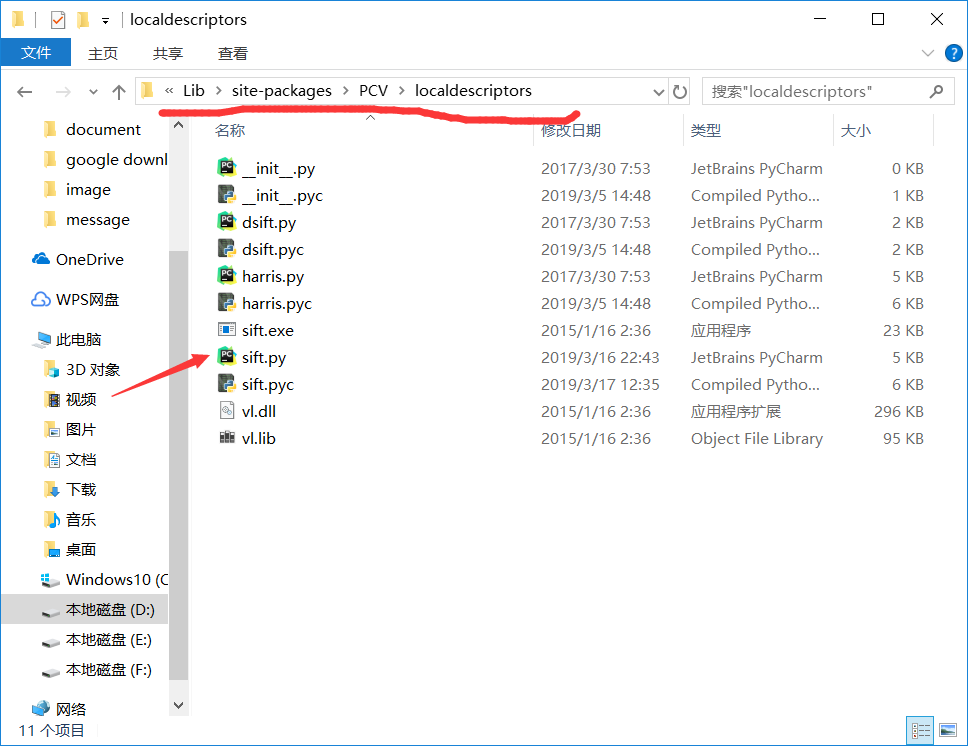
在sift.py中找到如下代码,并将cmmd中的路径改为sift.exe的所在路径(就是刚刚存放在同PCV目录的win64文件夹的里头),这里要特别注意以下,sift.exe路径后一定要加个空格!这可是个大坑
def process_image(imagename,resultname,params="--edge-thresh 10 --peak-thresh 5"):""" process an image and save the results in a file"""# path = os.path.abspath(os.path.join(os.path.dirname("__file__"),os.path.pardir))# path = path+"\\utils\\win32vlfeat\\sift.exe "if imagename[-3:] != 'pgm':#create a pgm fileim = Image.open(imagename).convert('L')im.save('tmp.pgm')imagename = 'tmp.pgm'cmmd = str("D:\\Pycharm\\test\\win64_vlfeat\\sift.exe "+imagename+" --output="+resultname+" "+params)os.system(cmmd)print 'processed', imagename, 'to', resultname
好了,现在vlfeat工具包安装完成
2、安装Graphviz和pydot
注意:一定要先安装Graphviz!注意顺序
安装Graphviz
在官网上下载graphviz-2.38.msi
下载好之后双击graphviz-2.38.msi,选择安装路径(这个路径要记住,后面要配置环境变量)
安装完成之后配置环境变量
右键我的电脑->属性->高级系统设置->环境变量->系统变量->Path,在Path里添加Graphviz-2.38文件夹下的bin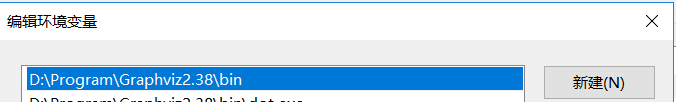
在命令行界面中输入dot -version检测是否安装成功,出现如下界面则说明安装成功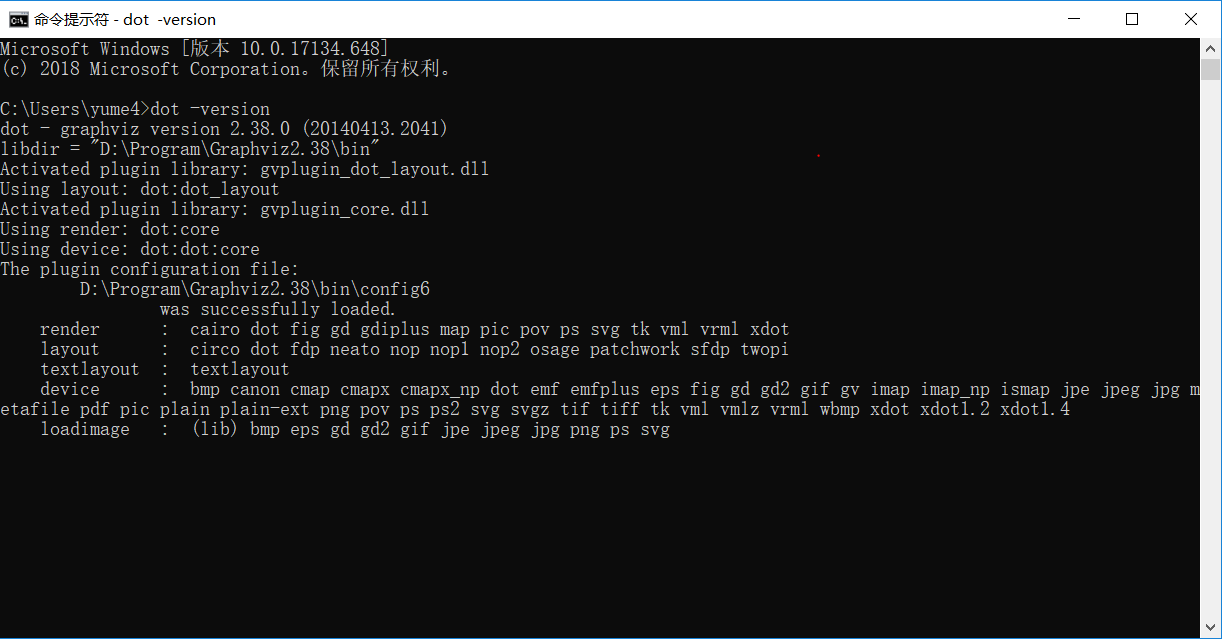
安装pydot
在命令行界面中输入pip install pydot==1.1.0
在python工具下运行
import pydotg = pydot.Dot(graph_type='graph')g.add_node(pydot.Node(str(0), fontcolor='transparent'))for i in range(5):g.add_node(pydot.Node(str(i + 1)))g.add_edge(pydot.Edge(str(0), str(i + 1)))for j in range(5):g.add_node(pydot.Node(str(j + 1) + '0' + str(i + 1)))g.add_edge(pydot.Edge(str(j + 1) + '0' + str(i + 1), str(j + 1)))g.write_png(E:/study_work/python/images/test.png', prog='neato')
出现下图则说明安装成功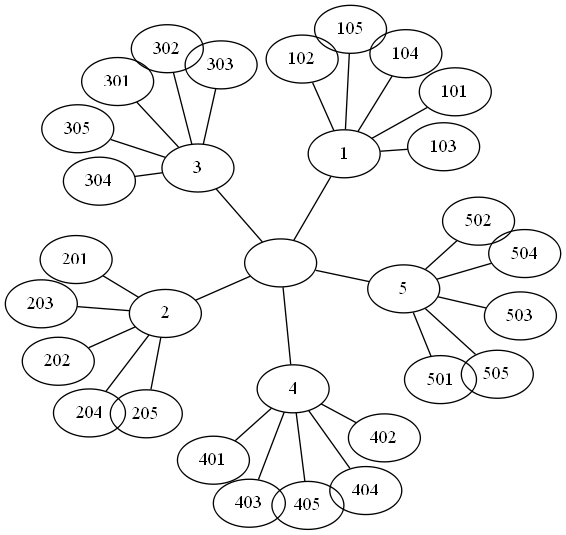
参考
Pytthon计算机视觉编程第二章


还没有评论,来说两句吧...