【Python】matplotlib画图在坐标轴之外显示
这个点的坐标刚好在1,1上,显示不全

参考官网 //matplotlib.org/api/_as_gen/matplotlib.artist.Artist.set_clip_on.html#matplotlib.artist.Artist.set_clip_on
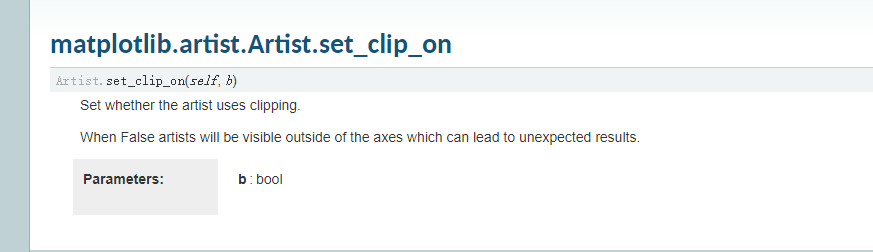
lip_on=False关掉裁剪功能,使能在坐标轴外显示import matplotlib.pyplot as pltplt.plot(range( 5),range(5),'ro',markersize = 20,clip_on = False,zorder = 100)plt.show()


truffle + web3 + webpack Metcoin 运行")


还没有评论,来说两句吧...