在Vue中使用echarts
一,安装echarts
cnpm i echarts@4.9.0 -S
" class="reference-link">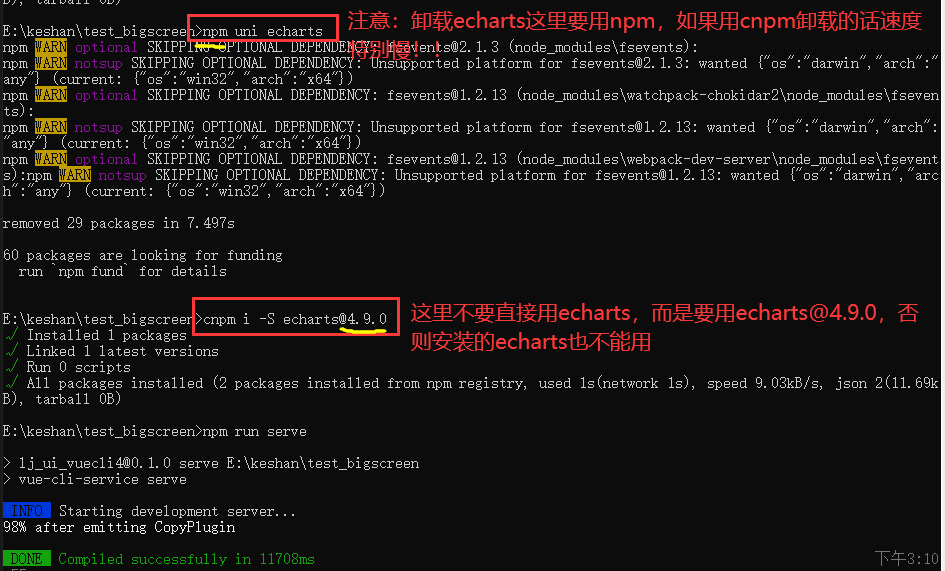
(echarts通常用这种方式引入:import echarts from ‘echarts’。如果不行的话,就用这种引入方式:import * as echarts from ‘echarts’。)
二,新建echarts.vue
内容如下:
<template><div class="chart-container"><el-row><el-col :span="12"><div id="chartColumn" style="width:500px; height:400px;"></div></el-col><el-col :span="12"><div id="chartBar" style="width:500px; height:400px;"></div></el-col><el-col :span="12"><div id="chartLine" style="width:500px; height:400px;"></div></el-col><el-col :span="12"><div id="chartPie" style="width:500px; height:400px;"></div></el-col></el-row></div></template><script>import echarts from 'echarts'export default {data() {return {chartColumn: null,chartBar: null,chartLine: null,chartPie: null}},methods: {drawColumnChart() {this.chartColumn = echarts.init(document.getElementById('chartColumn'));this.chartColumn.setOption({title: { text: 'Column Chart' },tooltip: {},xAxis: {data: ["衬衫", "羊毛衫", "雪纺衫", "裤子", "高跟鞋", "袜子"]},yAxis: {},series: [{name: '销量',type: 'bar',data: [5, 20, 36, 10, 10, 20]}]});},drawBarChart() {this.chartBar = echarts.init(document.getElementById('chartBar'));this.chartBar.setOption({title: {text: 'Bar Chart',subtext: '数据来自网络'},tooltip: {trigger: 'axis',axisPointer: {type: 'shadow'}},legend: {data: ['2011年', '2012年']},grid: {left: '3%',right: '4%',bottom: '3%',containLabel: true},xAxis: {type: 'value',boundaryGap: [0, 0.01]},yAxis: {type: 'category',data: ['巴西', '印尼', '美国', '印度', '中国', '世界人口(万)']},series: [{name: '2011年',type: 'bar',data: [18203, 23489, 29034, 104970, 131744, 630230]},{name: '2012年',type: 'bar',data: [19325, 23438, 31000, 121594, 134141, 681807]}]});},drawLineChart() {this.chartLine = echarts.init(document.getElementById('chartLine'));this.chartLine.setOption({title: {text: 'Line Chart'},tooltip: {trigger: 'axis'},legend: {data: ['邮件营销', '联盟广告', '搜索引擎']},grid: {left: '3%',right: '4%',bottom: '3%',containLabel: true},xAxis: {type: 'category',boundaryGap: false,data: ['周一', '周二', '周三', '周四', '周五', '周六', '周日']},yAxis: {type: 'value'},series: [{name: '邮件营销',type: 'line',stack: '总量',data: [120, 132, 101, 134, 90, 230, 210]},{name: '联盟广告',type: 'line',stack: '总量',data: [220, 182, 191, 234, 290, 330, 310]},{name: '搜索引擎',type: 'line',stack: '总量',data: [820, 932, 901, 934, 1290, 1330, 1320]}]});},drawPieChart() {this.chartPie = echarts.init(document.getElementById('chartPie'));this.chartPie.setOption({title: {text: 'Pie Chart',subtext: '纯属虚构',x: 'center'},tooltip: {trigger: 'item',formatter: "{a} <br/>{b} : {c} ({d}%)"},legend: {orient: 'vertical',left: 'left',data: ['直接访问', '邮件营销', '联盟广告', '视频广告', '搜索引擎']},series: [{name: '访问来源',type: 'pie',radius: '55%',center: ['50%', '60%'],data: [{ value: 335, name: '直接访问' },{ value: 310, name: '邮件营销' },{ value: 234, name: '联盟广告' },{ value: 135, name: '视频广告' },{ value: 1548, name: '搜索引擎' }],itemStyle: {emphasis: {shadowBlur: 10,shadowOffsetX: 0,shadowColor: 'rgba(0, 0, 0, 0.5)'}}}]});},drawCharts() {this.drawColumnChart()this.drawBarChart()this.drawLineChart()this.drawPieChart()},},mounted: function () {this.drawCharts()},updated: function () {this.drawCharts()}}</script><style scoped>.chart-container {background-color:white;height: 100%;width: 100%;}.el-col {padding: 30px;}</style>
三,运行结果


还没有评论,来说两句吧...