点击网页跟踪php代码的工具,Ytrace是一个PHP代码调试跟踪工具
This is a web ui for ytrace, see also ytrace_chrome_extension.
Why
I need to take over some project. To understand the code logic, I have to debug the code(many code is dirty but run:-)). I can use var_dump/die(this is inefficient) or the powerful debug tool XDebug(but traces and remote debugging still not so convenient).
So, I create this tool, make traces combined with step-through debugging. Hope it useful for you.
feature
step through debugging
break point
jump to any executed source code line
step back through your step history
Install
git clone this project
composer install
in project root dir, run php -S localhost:8088
By default, ytrace_gui will detect ytrace.output_dir from ini_get. If need, you can edit index.php, change //define(‘YTRACE_OUTPUT_DIR’, ‘/tmp/ytrace/‘);
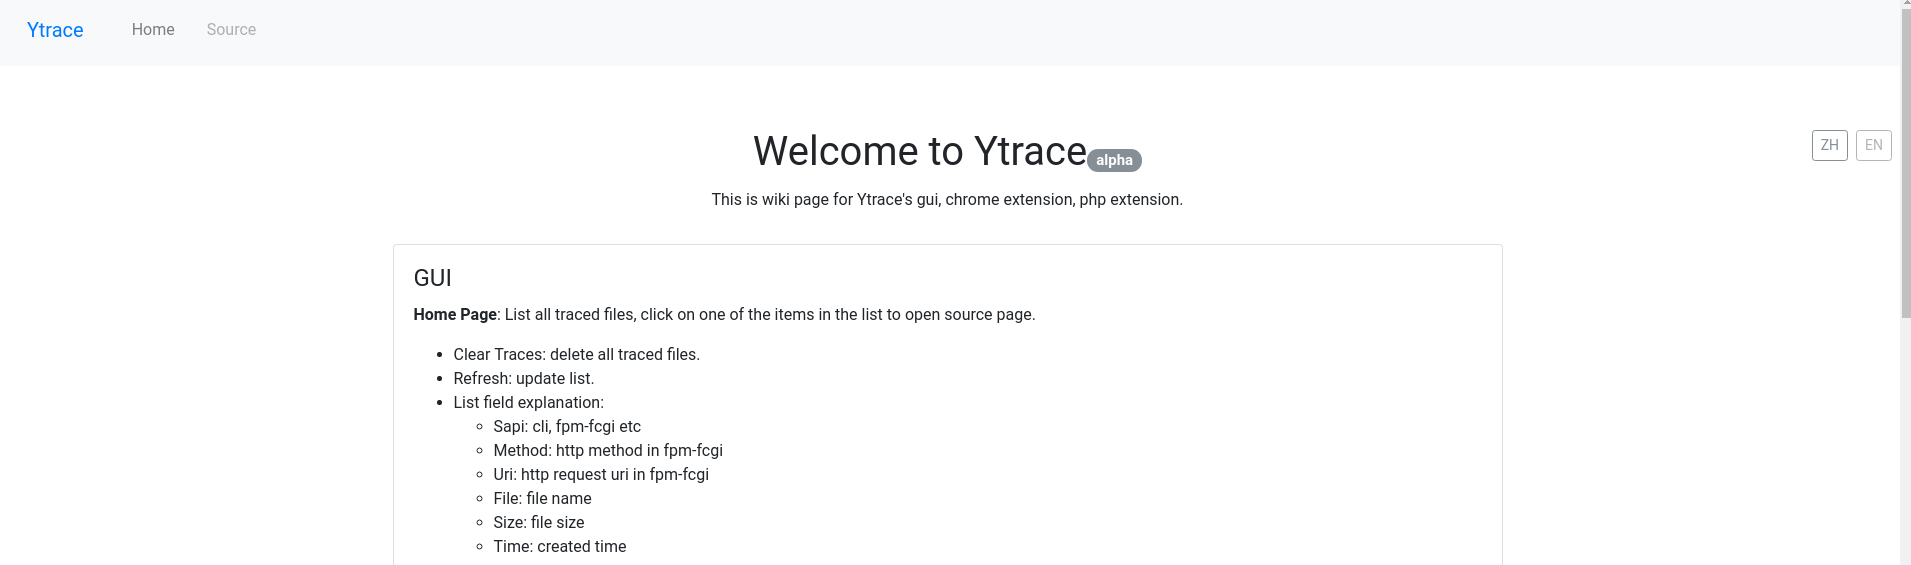
Wiki
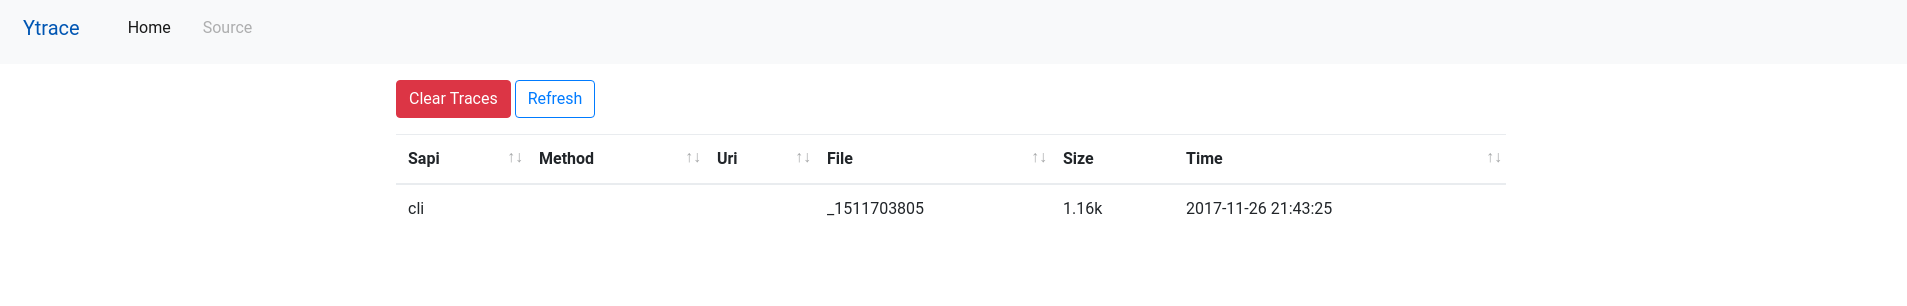
Home Page: List all traced files, click on one of the items in the list to open source page.
Clear Traces: delete all traced files.
Refresh: update list.
List field explanation:
Sapi: cli, fpm-fcgi etc
Method: http method in fpm-fcgi
Uri: http request uri in fpm-fcgi
File: file name
Size: file size
Time: created time
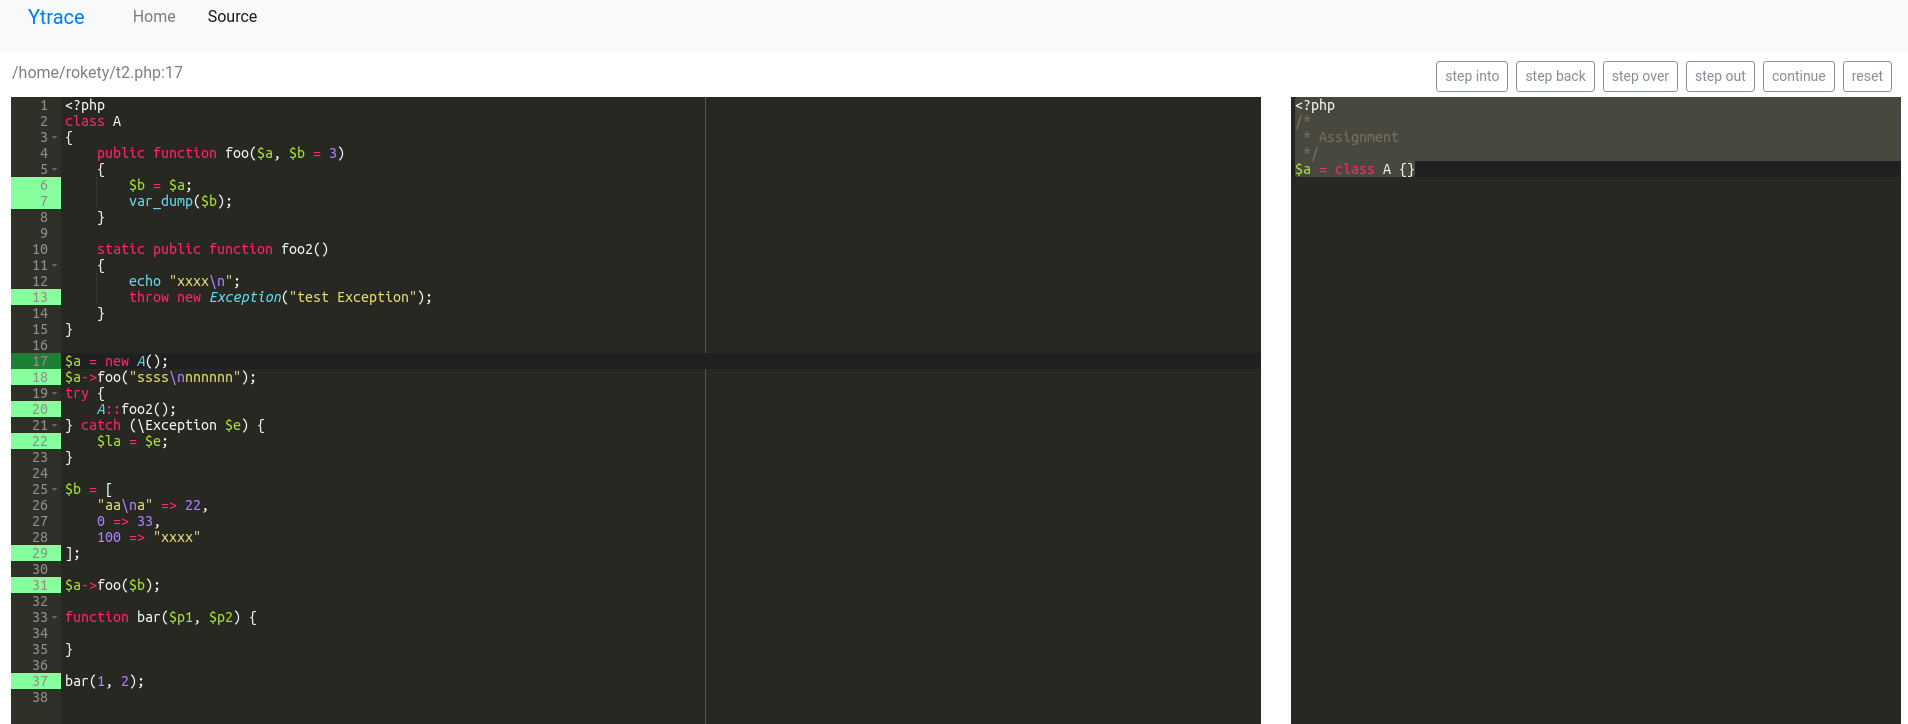
Source Page: show detail of traced files.
source code show in left side, traced value show in right side.
only assignment and function call will be traced
++, —, +=, /=, -=, *=, %= etc, shows the values before these operators execute
PHP 7 cannot show internal function parameters name (parameter name cannot be found will be showed as $…)
executed line will be highlight in green, dark green means current execute
click highlighted line number, can jump current execute to it
ctrl+click line number, can set/clear a breakpoint (breakpoint will be highlight in red line number)
execute operation:
step into: same with gdb
step back: execute back through your step history
step over: same with gdb
step out: same with gdb
continue: same with gdb, execute to next breakpoint
reset: reset execute to first entry
shortcut:
ctrl+o: open 10 latest traced file popup list
ctrl+p: open traced source file popup list, only available in source page
ctrl+r: open current source file function/method popup list, only available in source page
ctrl+b: open breakpoints popup list, only available in source page


")


还没有评论,来说两句吧...