Vue.js 项目 Element-UI 组件库引入 Echarts 图表
安装 Echarts
>> npm install echarts --save
main.js 引入 Echarts
## main.jsimport Vue from 'vue'import ElementUI from 'element-ui'import 'element-ui/lib/theme-chalk/index.css'import 'lib-flexible/flexible'import './assets/css/index.css'import router from "@/router/index"import echarts from 'echarts'import '@/assets/js/walden.js'import App from './App.vue'Vue.config.productionTip = falseVue.prototype.$echarts = echartsVue.use(ElementUI)new Vue({router,render: h => h(App),}).$mount('#app')
引入 Echarts 主题 walden

Vue 页面绘制 Echarts 图表
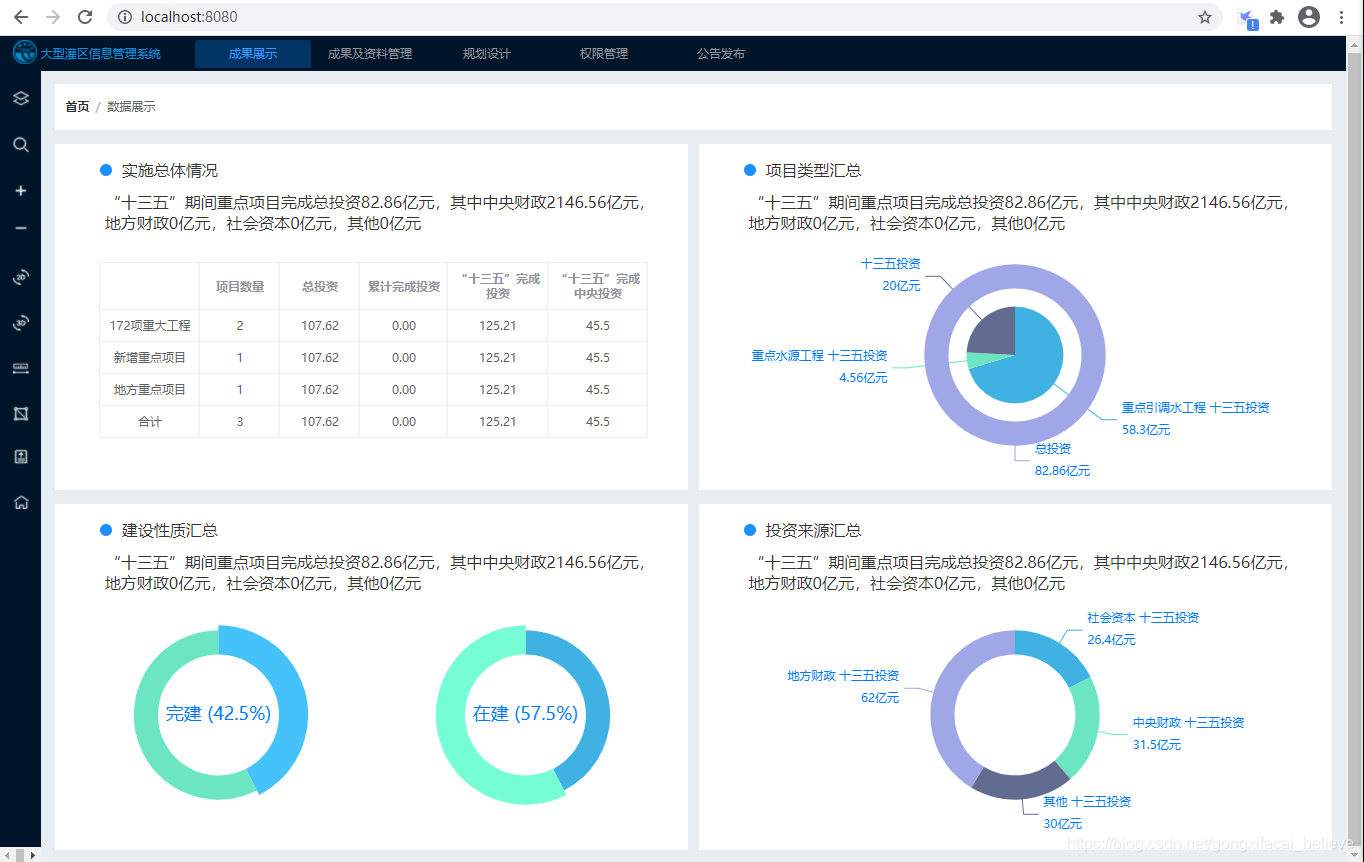
## EchartsPane.vue<template><el-main><el-breadcrumb separator="/"><el-breadcrumb-item :to="{ path: '/' }">首页</el-breadcrumb-item><el-breadcrumb-item>数据展示</el-breadcrumb-item></el-breadcrumb><el-row :gutter="20" class="row-pane"><el-col :span="12" class="col-1"><el-row><el-col :span="2" style="width: 12px; height: 12px; background: #1890FF; border-radius: 50%; margin: 20px 0 0 35px;"></el-col><el-col :span="22" style="width: 150px; height: 15px; font-size: 16px; font-family: Alibaba PuHuiTi; font-weight: 400; color: #333333; margin: 15px 0 0 10px;">实施总体情况</el-col></el-row><el-row><el-col style="width: 90%; height: 43px; font-size: 16px; font-family: Alibaba PuHuiTi; font-weight: 400; color: #333333; margin: 15px 0 0 40px;">“十三五”期间重点项目完成总投资82.86亿元,其中中央财政2146.56亿元,地方财政0亿元,社会资本0亿元,其他0亿元</el-col></el-row><el-row><el-table :data="tableData" border><el-table-column header-align="center" align="center" prop="leftHeader" label="" width="100"></el-table-column><el-table-column header-align="center" align="center" prop="number" label="项目数量" width="80"></el-table-column><el-table-column header-align="center" align="center" prop="totalInvestment" label="总投资" width="80"></el-table-column><el-table-column header-align="center" align="center" prop="totalComplete" label="累计完成投资" width="88"></el-table-column><el-table-column header-align="center" align="center" prop="curComplete" label="“十三五”完成投资" width="100"></el-table-column><el-table-column header-align="center" align="center" prop="curCenterComplete" label="“十三五”完成中央投资" width="100"></el-table-column></el-table></el-row></el-col><el-col :span="12" class="col-2"><el-row><el-col :span="2" style="width: 12px; height: 12px; background: #1890FF; border-radius: 50%; margin: 20px 0 0 35px;"></el-col><el-col :span="22" style="width: 150px; height: 15px; font-size: 16px; font-family: Alibaba PuHuiTi; font-weight: 400; color: #333333; margin: 15px 0 0 10px;">项目类型汇总</el-col></el-row><el-row><el-col style="width: 90%; height: 43px; font-size: 16px; font-family: Alibaba PuHuiTi; font-weight: 400; color: #333333; margin: 15px 0 0 40px;">“十三五”期间重点项目完成总投资82.86亿元,其中中央财政2146.56亿元,地方财政0亿元,社会资本0亿元,其他0亿元</el-col></el-row><el-row><div id="echart1"></div></el-row></el-col></el-row><el-row :gutter="20" class="row-pane"><el-col :span="12" class="col-1"><el-row><el-col :span="2" style="width: 12px; height: 12px; background: #1890FF; border-radius: 50%; margin: 20px 0 0 35px;"></el-col><el-col :span="22" style="width: 150px; height: 15px; font-size: 16px; font-family: Alibaba PuHuiTi; font-weight: 400; color: #333333; margin: 15px 0 0 10px;">建设性质汇总</el-col></el-row><el-row><el-col style="width: 90%; height: 43px; font-size: 16px; font-family: Alibaba PuHuiTi; font-weight: 400; color: #333333; margin: 15px 0 0 40px;">“十三五”期间重点项目完成总投资82.86亿元,其中中央财政2146.56亿元,地方财政0亿元,社会资本0亿元,其他0亿元</el-col></el-row><el-row><div id="echart23"><div id="echart2"></div><div id="echart3"></div></div></el-row></el-col><el-col :span="12" class="col-2"><el-row><el-col :span="2" style="width: 12px; height: 12px; background: #1890FF; border-radius: 50%; margin: 20px 0 0 35px;"></el-col><el-col :span="22" style="width: 150px; height: 15px; font-size: 16px; font-family: Alibaba PuHuiTi; font-weight: 400; color: #333333; margin: 15px 0 0 10px;">投资来源汇总</el-col></el-row><el-row><el-col style="width: 90%; height: 43px; font-size: 16px; font-family: Alibaba PuHuiTi; font-weight: 400; color: #333333; margin: 15px 0 0 40px;">“十三五”期间重点项目完成总投资82.86亿元,其中中央财政2146.56亿元,地方财政0亿元,社会资本0亿元,其他0亿元</el-col></el-row><el-row><div id="echart4"></div></el-row></el-col></el-row></el-main></template><script> export default { name: "EchartsPane", data(){ return { tableData: [{ leftHeader: '172项重大工程', number: '2', totalInvestment: '107.62', totalComplete: '0.00', curComplete: '125.21', curCenterComplete: '45.5' }, { leftHeader: '新增重点项目', number: '1', totalInvestment: '107.62', totalComplete: '0.00', curComplete: '125.21', curCenterComplete: '45.5' }, { leftHeader: '地方重点项目', number: '1', totalInvestment: '107.62', totalComplete: '0.00', curComplete: '125.21', curCenterComplete: '45.5' }, { leftHeader: '合计', number: '3', totalInvestment: '107.62', totalComplete: '0.00', curComplete: '125.21', curCenterComplete: '45.5' }] } }, mounted() { this.onInitEchart1(); this.onInitEchart2(); this.onInitEchart3(); this.onInitEchart4(); }, methods: { onInitEchart1(){ let echarts = require('echarts'); let myChart = echarts.init(document.getElementById('echart1'), 'walden'); let option = { tooltip: { trigger: 'item', formatter: '{b}: {c} ({d}%)' }, series: [ { type: 'pie', selectedMode: 'single', radius: [0, '40%'], label: { position: 'outer', formatter: '{b}\n{c}亿元', color: '#0078FF', fontSize: 12, lineHeight: 22 }, labelLine: { show: true, length: 60 }, data: [ { value: 58.3, name: '重点引调水工程 十三五投资'}, { value: 4.56, name: '重点水源工程 十三五投资'}, { value: 20, name: '十三五投资'} ] }, { type: 'pie', radius: ['55%', '75%'], label: { position: 'outer', formatter: '{b}\n{c}亿元', color: '#0078FF', fontSize: 12, lineHeight: 22 }, labelLine: { show: true }, data: [ { value: 82.86, name: '总投资'} ] } ] }; myChart.setOption(option); }, onInitEchart2(){ let echarts = require('echarts'); let myChart = echarts.init(document.getElementById('echart2'), 'walden'); let option = { tooltip: { trigger: 'item', formatter: '{b}: {c} ({d}%)' }, series: [ { type: 'pie', radius: ['50%', '70%'], avoidLabelOverlap: false, label: { show: false, position: 'center' }, emphasis: { label: { show: true, fontSize: '18', color: '#0078FF', formatter: '{b} ({d}%)' } }, labelLine: { show: false }, data: [ { value: 42.5, name: '完建', selected: true}, { value: 57.5, name: '在建'} ] } ] }; myChart.setOption(option); let index = 0; myChart.dispatchAction({ type: 'highlight', seriesIndex: 0, dataIndex: 0 }); myChart.on("mouseover", function(e) { if (e.dataIndex != index) { myChart.dispatchAction({ type: "downplay", seriesIndex: 0, dataIndex: index }); } }); myChart.on("mouseout", function(e) { index = e.dataIndex; myChart.dispatchAction({ type: "highlight", seriesIndex: 0, dataIndex: 0 }); }); }, onInitEchart3(){ let echarts = require('echarts'); let myChart = echarts.init(document.getElementById('echart3'), 'walden'); let option = { tooltip: { trigger: 'item', formatter: '{b}: {c} ({d}%)' }, series: [ { type: 'pie', radius: ['50%', '70%'], avoidLabelOverlap: false, label: { show: false, position: 'center' }, emphasis: { label: { show: true, fontSize: '18', color: '#0078FF', formatter: '{b} ({d}%)' } }, labelLine: { show: false }, data: [ { value: 42.5, name: '完建'}, { value: 57.5, name: '在建', selected: true} ] } ] }; myChart.setOption(option); let index = 1; myChart.dispatchAction({ type: 'highlight', seriesIndex: 0, dataIndex: 1 }); myChart.on("mouseover", function(e) { if (e.dataIndex != index) { myChart.dispatchAction({ type: "downplay", seriesIndex: 0, dataIndex: index }); } }); myChart.on("mouseout", function(e) { index = e.dataIndex; myChart.dispatchAction({ type: "highlight", seriesIndex: 0, dataIndex: 1 }); }); }, onInitEchart4(){ let echarts = require('echarts'); let myChart = echarts.init(document.getElementById('echart4'), 'walden'); let option = { tooltip: { trigger: 'item', formatter: '{b}: {c} ({d}%)' }, series: [ { type: 'pie', radius: ['50%', '70%'], avoidLabelOverlap: false, label: { position: 'outer', formatter: '{b}\n{c}亿元', color: '#0078FF', fontSize: 12, lineHeight: 22 }, emphasis: { label: { show: true } }, labelLine: { show: true }, data: [ { value: 26.4, name: '社会资本 十三五投资'}, { value: 31.5, name: '中央财政 十三五投资'}, { value: 30, name: '其他 十三五投资'}, { value: 62, name: '地方财政 十三五投资'}, ] } ] }; myChart.setOption(option); } } } </script><style scoped> .row-pane { height: 500px !important; margin: 20px 0 0 0 !important; } .col-1 { background-color: white; height: 500px !important; width: 49.6%; float: left; } .col-2 { background-color: white; height: 500px !important; width: 49.6%; float: right; } #echart1, #echart2, #echart3, #echart4 { height: 350px; width: 800px; margin: 0 auto; } #echart23 { display: flex; } </style>
运行效果
左侧栏折叠效果:
左侧栏展开效果:


盒子模型,边框,内外边距,盒子模型布局,ps基本操作,列表样式,圆角边框,盒子阴影")


还没有评论,来说两句吧...