记OceanBase死锁超时
背景
线上环境大促活动期间内容平台偶发数据库连接报错,报错信息为 com.mysql.jdbc.exceptions.jdbc4.CommunicationsException: Communications link failure ,初步以为是数据库的其他租户给数据库服务器压力大,导致服务端异常断开了内容平台的数据库连接,因此把这个异常当做数据库服务器不稳定直接忽略了。但后续大促活动已经过去,依然偶发会报同样的异常,这才意识到该异常也许不是数据库服务器不稳定导致。
分析
问题排查
查看应用监控和错误日志后发现,每次偶发报错时,必然会同时至少有两个数据库连接异常。抽样一次报错信息如下:
节点1报错日志:
2021-08-09 10:16:55,062 [0b215c94162847541000171562649 0.1.23.9 - /// - ] ERROR template.IcontentcenterServiceTemplate - facade service [ContentManageFacadeImpl.batchSaveOrUpdate4DataSync] biz handle exception:### Error querying database. Cause: com.mysql.jdbc.exceptions.jdbc4.CommunicationsException: Communications link failureThe last packet successfully received from the server was 5,001 milliseconds ago. The last packet sent successfully to the server was 5,001 milliseconds ago.### The error may exist in ContentLibDAO.xml### The error may involve defaultParameterMap### The error occurred while setting parameters### SQL: select content_id from cc_content_lib where content_id =? for update### Cause: com.mysql.jdbc.exceptions.jdbc4.CommunicationsException: Communications link failure
节点2报错日志:
2021-08-09 10:16:55,071 [0b24553d162847541000028351928 0.1.23 - /// - ] ERROR template.IcontentcenterServiceTemplate - facade service [ContentManageFacadeImpl.batchSaveOrUpdate4DataSync] biz handle exception:### Error querying database. Cause: com.mysql.jdbc.exceptions.jdbc4.CommunicationsException: Communications link failureThe last packet successfully received from the server was 5,003 milliseconds ago. The last packet sent successfully to the server was 5,003 milliseconds ago.### The error may exist in ContentLibDAO.xml### The error may involve defaultParameterMap### The error occurred while setting parameters### SQL: select content_id from cc_content_lib where content_id =? for update### Cause: com.mysql.jdbc.exceptions.jdbc4.CommunicationsException: Communications link failure
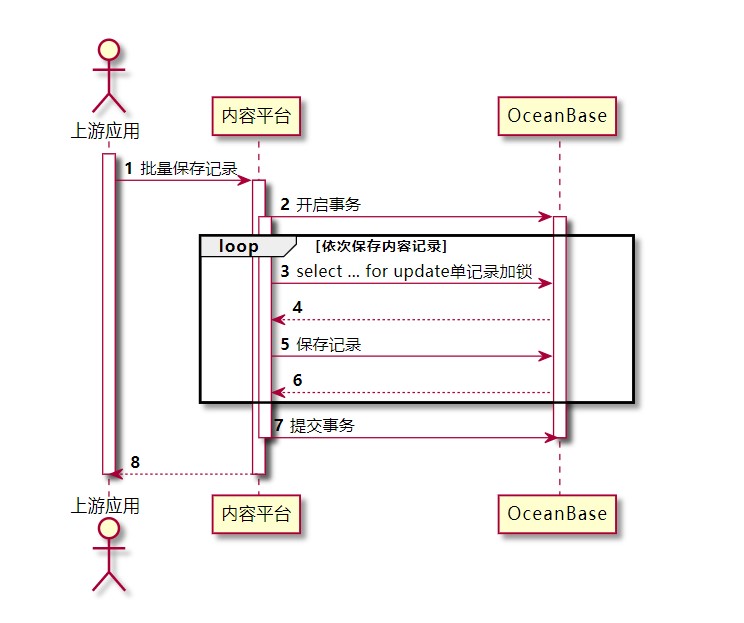
所有的报错连接均执行的同一个sql语句select content_id from cc_content_lib where content_id =? for update ,其业务场景如下所示:当外部系统请求内容平台批量保存记录时,内容平台在同一个事务中对所有的记录依次先上锁,再更新保存记录。根据错误信息显然是记录上锁超时,导致连接超时异常中断。
进一步去日志中翻找等待锁超时的具体SQL语句,尝试分析两个报错数据库连接事务期间,分别对哪些记录上锁成功,又再哪条记录等待锁超时。
节点1等待锁超时的报错SQL:
[2021-08-09 10:16:55.056483] WARN [PROXY.SM] update_stats (ob_mysql_sm.cpp:5603) [689][Y0-7F87DAB3D1A0] [lt=11] [dc=0] Slow transaction: (client_ip={127.0.0.1:56212}, server_ip={11.232.196.24:2881}, server_trace_id=, route_type=ROUTE_TYPE_LEADER, use_compress_protocol=false, cs_id=0, proxy_sessid=0, ss_id=0, server_sessid=0, sm_id=753, state=0, trans_stats_={client_requests:7, server_responses:6, pl_lookup_retries:0, server_retries:0, client_request_bytes:4298, server_request_bytes:4442, server_response_bytes:52, client_response_bytes:8480, client_transaction_idle_time_us=9148, client_process_request_time_us=166, client_request_read_time_us=68, client_request_analyze_time_us=58, cluster_resource_create_time_us=0, pl_lookup_time_us=9, pl_process_time_us=8, congestion_control_time_us=4, congestion_process_time_us=0, do_observer_open_time_us=12, server_connect_time_us=0, sync_session_variable_time_us=0, send_saved_login_time_us=0, send_use_database_time_us=0, send_session_vars_time_us=0, send_all_session_vars_time_us=0, send_last_insert_id_time_us=0, send_start_trans_time_us=0, build_server_request_time_us=22, plugin_compress_request_time_us=0, prepare_send_request_to_server_time_us=155, server_request_write_time_us=98, server_process_request_time_us=2331, server_response_read_time_us=15, plugin_decompress_response_time_us=30, server_response_analyze_time_us=18, ok_packet_trim_time_us=5, client_response_write_time_us=122, trans_time_us=5012776}, last_sql=selectcontent_idfrom cc_content_libwhere content_id ='sgprodsg_gc001goods2021071700133593'for update)
而该事务中依次上锁的记录ID如下
select content_id from cc_content_lib where content_id ='sgprodsg_gc001goods2021063000088402' for updateselect content_id from cc_content_lib where content_id ='sgprodsg_gc001goods2021071700133593' for update
节点2等待锁超时的报错SQL:
[2021-08-09 10:16:55.061845] WARN [PROXY.SM] update_stats (ob_mysql_sm.cpp:5603) [705][Y0-7F6EB9BF4200] [lt=15] [dc=0] Slow transaction: (client_ip={127.0.0.1:53752}, server_ip={11.232.196.24:2881}, server_trace_id=, route_type=ROUTE_TYPE_LEADER, use_compress_protocol=false, cs_id=0, proxy_sessid=0, ss_id=0, server_sessid=0, sm_id=653, state=0, trans_stats_={client_requests:11, server_responses:11, pl_lookup_retries:0, server_retries:0, client_request_bytes:7245, server_request_bytes:7461, server_response_bytes:104, client_response_bytes:12812, client_transaction_idle_time_us=19536, client_process_request_time_us=280, client_request_read_time_us=105, client_request_analyze_time_us=94, cluster_resource_create_time_us=0, pl_lookup_time_us=10, pl_process_time_us=10, congestion_control_time_us=4, congestion_process_time_us=0, do_observer_open_time_us=14, server_connect_time_us=0, sync_session_variable_time_us=1287, send_saved_login_time_us=0, send_use_database_time_us=0, send_session_vars_time_us=1287, send_all_session_vars_time_us=0, send_last_insert_id_time_us=0, send_start_trans_time_us=0, build_server_request_time_us=73, plugin_compress_request_time_us=0, prepare_send_request_to_server_time_us=1530, server_request_write_time_us=175, server_process_request_time_us=14393, server_response_read_time_us=66, plugin_decompress_response_time_us=47, server_response_analyze_time_us=33, ok_packet_trim_time_us=13, client_response_write_time_us=276, trans_time_us=5039088}, last_sql=selectcontent_idfrom cc_content_libwhere content_id ='sgprodsg_gc001goods2021063000088402'for update)
而该事务中依次上锁的记录ID如下
select content_id from cc_content_lib where content_id ='sgprodsg_gc001goods2021071700133593' for updateselect content_id from cc_content_lib where content_id ='sgprodsg_gc001goods2021063000089469' for updateselect content_id from cc_content_lib where content_id ='sgprodsg_gc001goods2021063000088402' for update
根据以上信息,可得两个连接事务对每条记录的上锁流程,如下表。显然是两个事务发生了死锁,事务1等待事务2,事务2等待事务1。但问题又来了,死锁为什么会导致连接超时报错?例如mysql的锁存在超时检查和主动检查,当出现两个事务相互等待锁而导致死锁时,直接通过主动检查而中断其中一个事务,而不用傻傻等待两个事务都超时失败,初步推测是OceanBase不支持死锁的主动检查能力。
| - | 事务1 | 事务2 |
|---|---|---|
| 步骤1 | sgprodsg_gc001goods2021063000088402上锁成功 | |
| 步骤2 | sgprodsg_gc001goods2021071700133593上锁成功 | |
| 步骤3 | sgprodsg_gc001goods2021071700133593等待锁 | |
| 步骤4 | sgprodsg_gc001goods2021063000089469上锁成功 | |
| 步骤5 | sgprodsg_gc001goods2021063000088402等待锁 | |
| 步骤6 | 超时报错 | 超时报错 |
问题复现
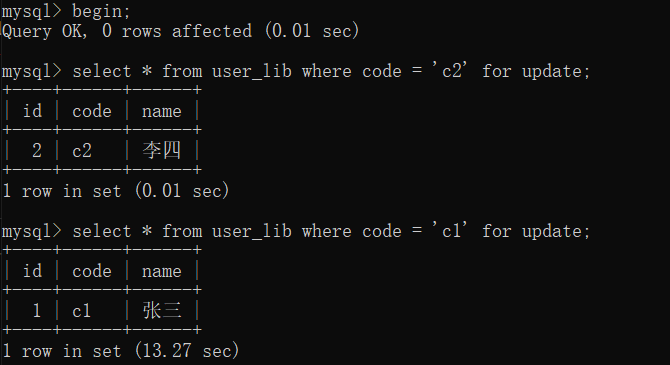
OceanBase死锁
| - | 事务1 | 事务2 |
|---|---|---|
| 步骤1 | c1上锁成功 | |
| 步骤2 | c2上锁成功 | |
| 步骤3 | c2等待锁 | |
| 步骤4 | c1等待锁 | |
| 步骤5 | 锁等待超时,事务中断,释放所有锁 | 锁等待超时,事务中断,释放所有锁 |
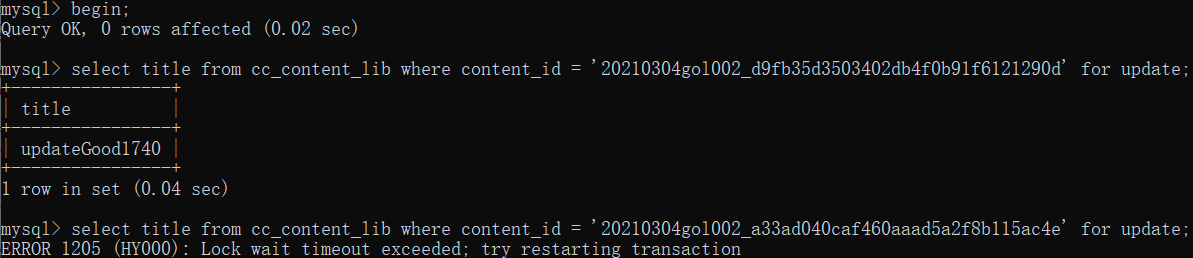
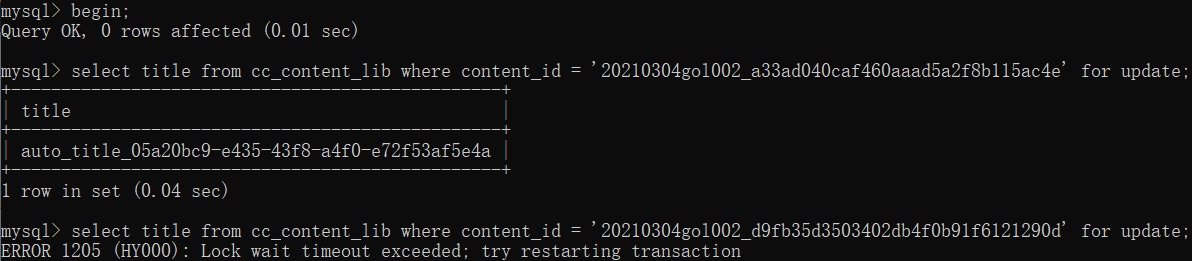
实测发现OceanBase的锁判断只有超时判断,没有死锁的主动检查。因此多个事务之间发生死锁时,客户端抛出来的异常是超时异常,而不是死锁异常。
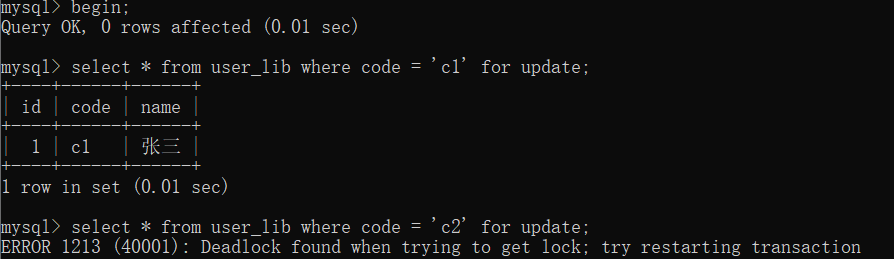
mysql死锁
再看看MySQL发生死锁的处理逻辑,当多个事务之间死锁后,MySQL通过死锁主动检查立即检测出锁资源的相互依赖问题,然后直接中断锁等待最久的事务从而释放该事务的锁资源,解决死锁问题。
| - | 事务1 | 事务2 |
|---|---|---|
| 步骤1 | c1上锁成功 | |
| 步骤2 | c2上锁成功 | |
| 步骤3 | c2等待锁 | |
| 步骤4 | c1等待锁 | |
| 步骤5 | 主动检查判断死锁,事务中断,释放所有锁 | |
| 步骤6 | c1上锁成功 |
解决
解决上述问题中的偶发超时问题,实际上就是要避免多个事务之间出现死锁。方案如下:
- 批量加锁
- 固定加锁顺序
方案一
方案一是将原先多条记录依次上锁修改成一次性给依赖的资源全部上锁,改写如下。
select content_id from cc_content_lib where content_id ='c1' for updateselect content_id from cc_content_lib where content_id ='c2' for updateselect content_id from cc_content_lib where content_id ='c3' for updateselect content_id from cc_content_lib where content_id in ('c1','c2','c3') for update
方案二
死锁的原因是因为多个事务之间出现锁依赖循环,因此在上锁前,对等待上锁记录进行排序,即固定加锁顺序,从而解决死锁问题。
该方案修改成本最低,因此最终选择了该方案作为最终解决方案。


")


还没有评论,来说两句吧...