When Documents Become Databases – Tabulizer R Wrapper for Tabula PDF Table Extractor
Although not necessarily the best way of publishing data, data tables in PDF documents can often be extracted quite easily, particularly if the tables are regular and the cell contents reasonably space.
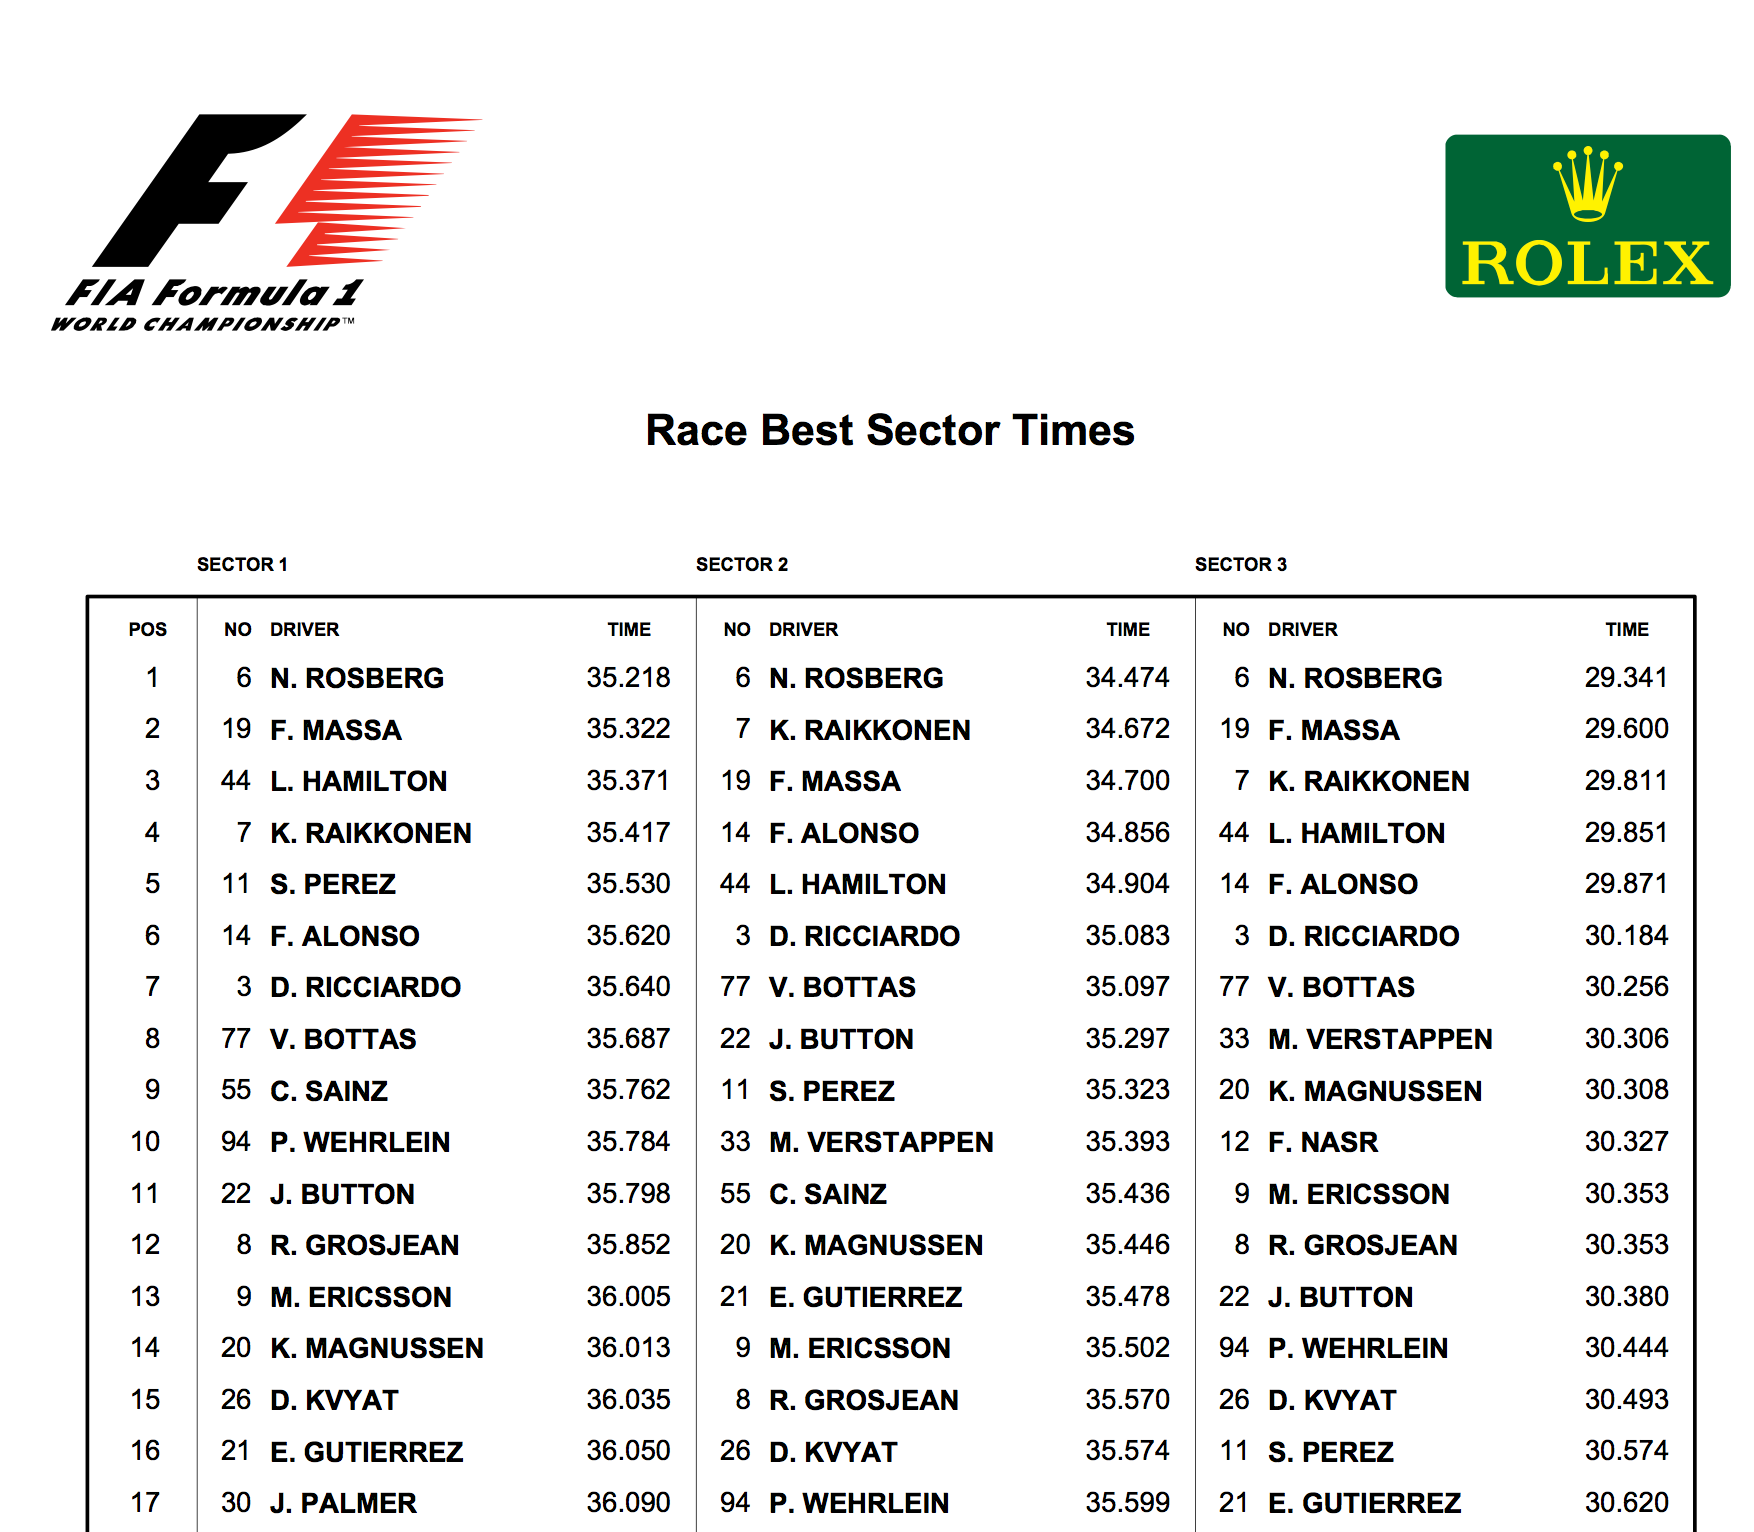
For example, official timing sheets for F1 races are published by the FIA as event and timing information in a set of PDF documents containing tabulated timing data:
In the past, I’ve written a variety of hand crafted scrapers to extract data from the timing sheets, but the regular way in which the data is presented in the documents means that they are quite amenable to scraping using a PDF table extractor such as Tabula. Tabula exists as both a server application, accessed via a web browser, or as a service using the tabula extractor Java application.
I don’t recall how I came across it, but the tabulizer R package provides a wrapper for tabula extractor (bundled within the package), that lets you access the service via it’s command line calls. (One dependency you do need to take care of is to have Java installed; adding Java into an RStudio docker container would be one way of taking care of this.)
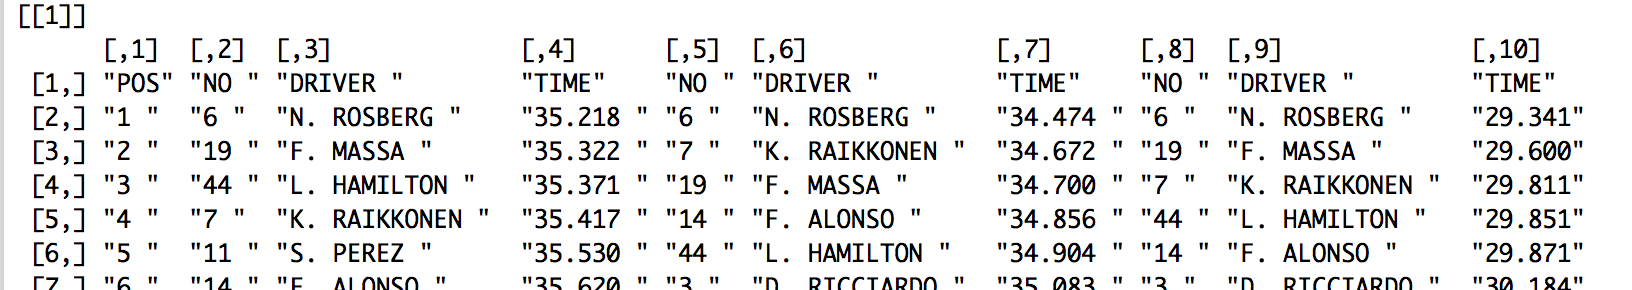
Running the default extractor command on the above PDF pulls out the data of the inner table:
extract_tables(‘Best Sector Times.pdf’)
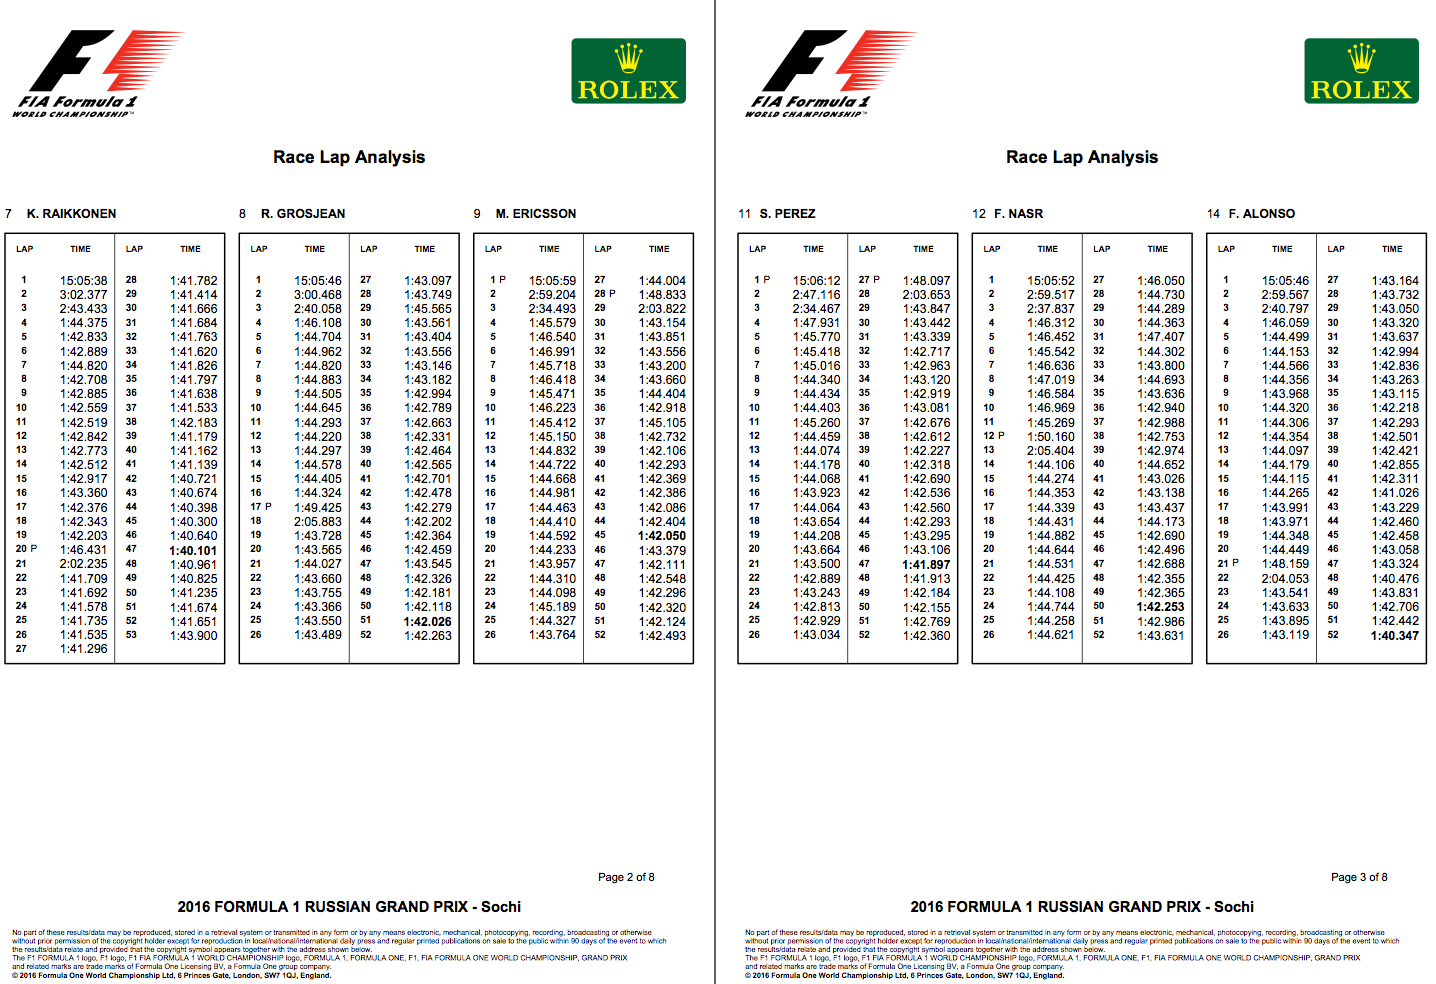
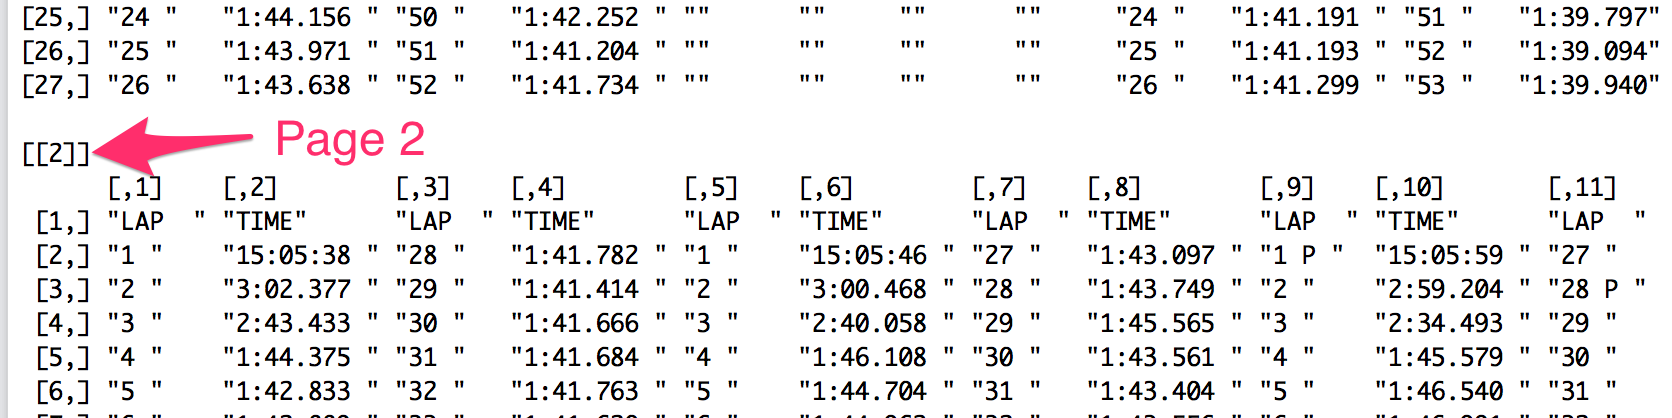
Where the data is spread across multiple pages, you get a data frame per page.
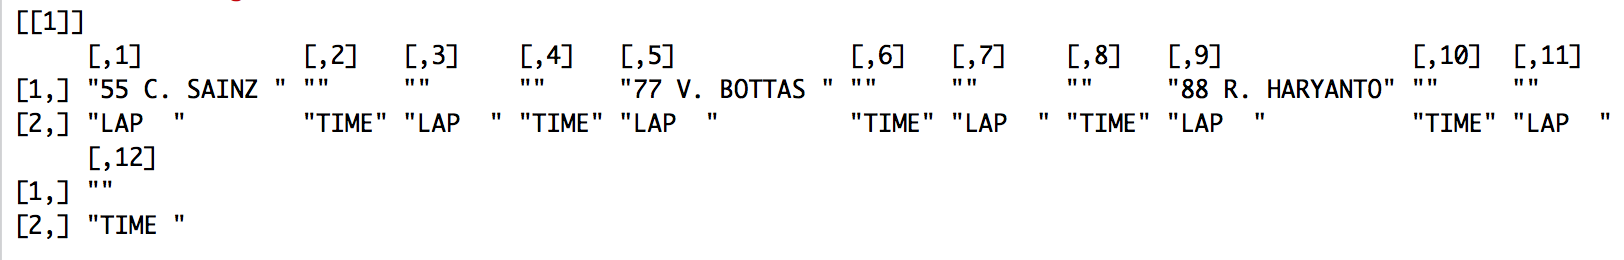
Note that the headings for the distinct tables are omitted. Tabula’s “table guesser” identifies the body of the table, but not the spanning column headers.
The default settings are such that tabula will try to scrape data from every page in the document.
Individual pages, or sets of pages, can be selected using the pagesparameter. For example:
- extract_tables(‘Lap Analysis.pdf’,pages=1
- extract_tables(‘Lap Analysis.pdf’,pages=c(2,3))
Specified areas for scraping can also be specified using the areaparameter:
extract_tables(‘Lap Analysis.pdf’, pages=8, guess=F, area=list(c(178, 10, 230, 500)))
The area parameter appears to take co-ordinates in the form: top, left, width, height is now fixed to take co-ordinates in the same form as those produced by tabula app debug: top, left, bottom, right.
You can find the necessary co-ordinates using the tabula app: if you select an area and preview the data, the selected co-ordinates are viewable in the browser developer tools console area.
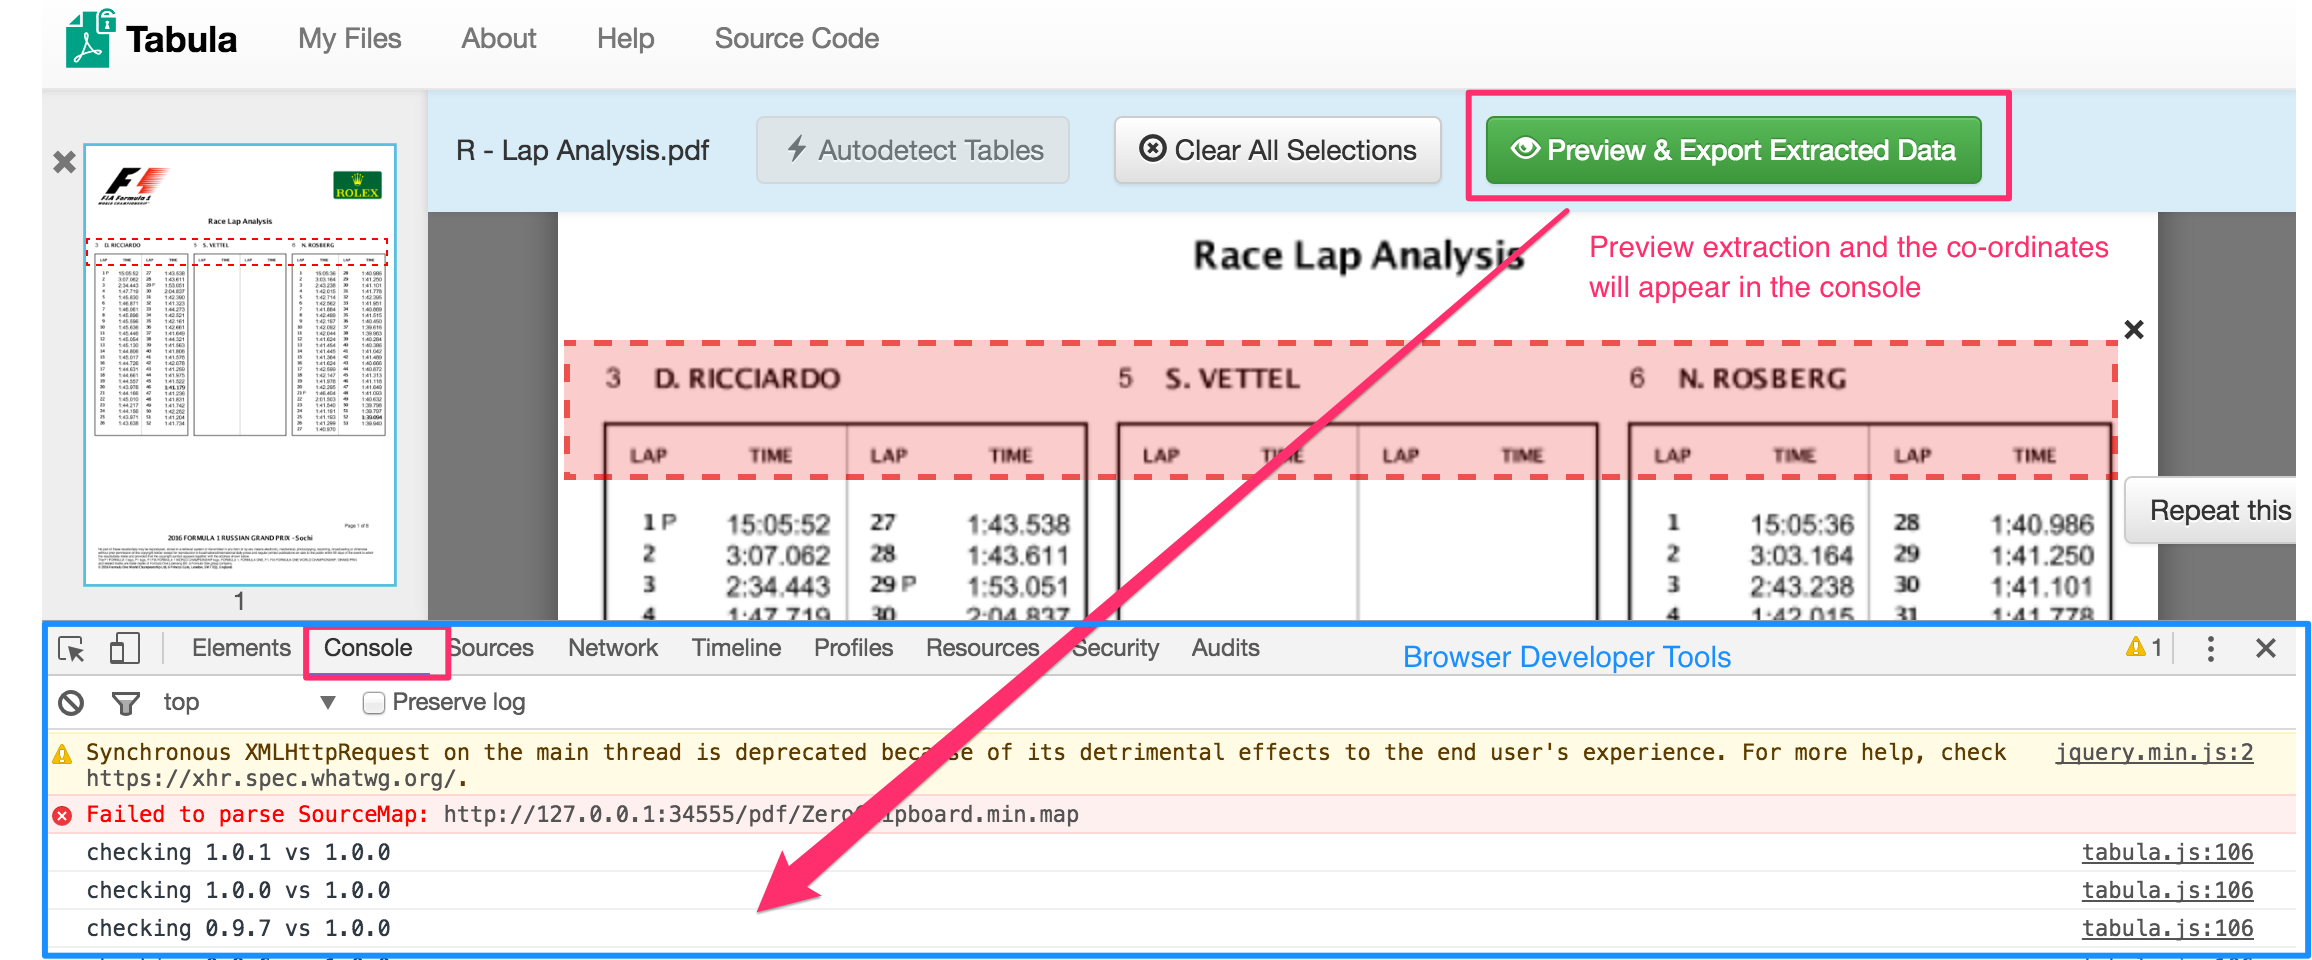
The tabula console output gives co-ordinates in the form: top, left, bottom, right so you need to do some sums to convert these numbers to the arguments that the tabulizer area parameter wants.
Using a combination of “guess” to find the dominant table, and specified areas, we can extract the data we need from the PDF and combine it to provide a structured and clearly labeled dataframe.
On my to do list: add this data source recipe to the Wrangling F1 Data With R book…


")


还没有评论,来说两句吧...