echarts 柱状图颜色渐变代码
设置echarts 颜色渐变方法。
实例样式:
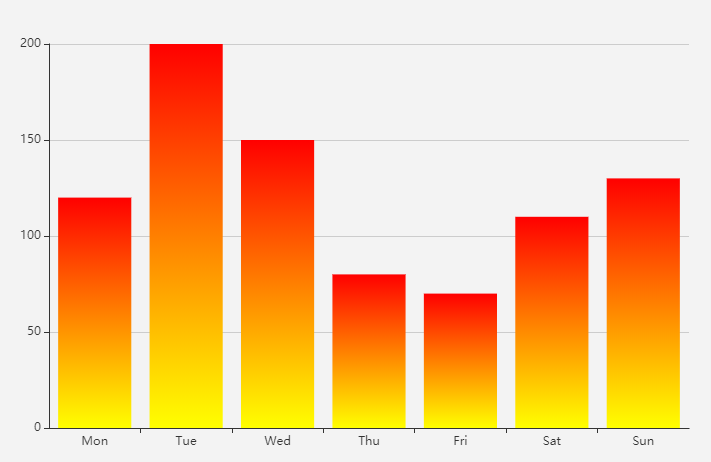
设置 series.itemStyle.normal
option = {xAxis: {type: 'category',data: ['Mon', 'Tue', 'Wed', 'Thu', 'Fri', 'Sat', 'Sun']},yAxis: {type: 'value'},series: [{data: [120, 200, 150, 80, 70, 110, 130],type: 'bar',itemStyle: {normal: {color: new echarts.graphic.LinearGradient(0, 0, 0, 1, [{offset: 0,color: 'red'}, {offset: 1,color: 'yellow'}]),}}}]};


")
实现")

算法")
之python实现")


还没有评论,来说两句吧...