使用docker安装filebeat收集日志
前言
本文主要是记录了使用docker-compose安装filebeat的过程,使用filebeat收集日志,直接发送到elasticsearch。kibana与elasticsearch已经提前安装,也是使用docker-compose安装,可参考我的文章https://blog.csdn.net/maquealone/article/details/89417257。
本来刚开始是想使用filebeat的nginx模块收集nginx日志的,但是开启nginx模块没有成功,一直报错,找了很多方法也没有解决,所以直接使用手动配置的方式来收集日志。
目录结构
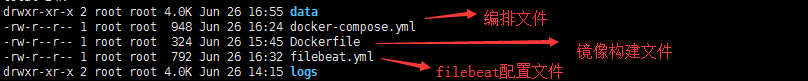
logs:日志目录
data: 数据目录
镜像构建文件
FROM registry.cn-hangzhou.aliyuncs.com/aliyunff/filebeat:6.5.4##enable Nginx modules,注意这里需要开启filebeat的Nginx模块# RUN /usr/share/filebeat/filebeat modules enable nginxCOPY filebeat.yml /usr/share/filebeat/filebeat.ymlUSER rootRUN chown root:filebeat /usr/share/filebeat/filebeat.ymlUSER filebeat
本来想在Dockerfile中启动nginx模块,然后通过nginx模块收集nginx日志的,但是不知为何启动nginx模块会报错,于是注释了启动nginx模块的命令,直接使用手动的方式手机日志。
编排文件
version: '2.3'services:beat:build:context: ${PWD}/.user: rootenvironment:- BEAT_STRICT_PERMS=falserestart: alwaysnetworks:- elastic_esnetvolumes:#filebeat.yml作为配置文件,ro表示只读- ${PWD}/filebeat.yml:/usr/share/filebeat/filebeat.yml:ro#为了filebeat的module.d配置nginx.yml- ${PWD}/modules.d:/usr/share/filebeat/modules.d- /var/lib/docker/containers:/var/lib/docker/containers:ro# We launch docker containers to test docker autodiscover:- /var/run/docker.sock:/var/run/docker.sock# 把logs和data共享出来- ${PWD}/logs:/usr/share/filebeat/logs- ${PWD}/data:/usr/share/filebeat/data##为了读取外部的日志文件,开启共享,下面举例为读取外部Nginx的/var/logs/nginx里的日志- /home/wwwlogs:/var/log/nginxnetworks:elastic_esnet:external: true
注意,此处的networks是关键,因为filebeat需要跟elasticsearch和kibana通信,所以必须让elasticsearch和kibana处于同一网络。由于我的elasticsearch与kibana之前已经通过docker-compose安装了,通过docker network ls查看网络。
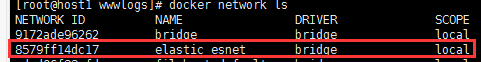
这个就是之前安装的elasticsearch使用的网络。
filebeat配置文件
filebeat.inputs:- type: logpaths:- /var/log/nginx/*.log#filebeat.config.modules:##加载modules的配置# path: ${path.config}/modules.d/*.yml# Set to true to enable config reloading# reload.enabled: true#-------------------------- Elasticsearch output ------------------------------# 这里我们不输出到es,果断注释掉output.elasticsearch:# Array of hosts to connect to.hosts: ["elasticsearch:9200"]#index: "filebeat-%{[agent.version]}-%{+yyyy.MM.dd}"#============================== Kibana =====================================# Starting with Beats version 6.0.0, the dashboards are loaded via the Kibana API.# This requires a Kibana endpoint configuration.setup.kibana:host: "kibana:5601"setup.dashboards:enabled: true
此处的重点是elasticsearch和kibana的地址一定要写成elasticsearch和kibana的服务名称,不要用默认的localhost,如果写成localhost会报连接elasticsearch失败的错误。因为elasticsearch、filebeat处于同一网络下,可以通过服务发现的方式进行通信。
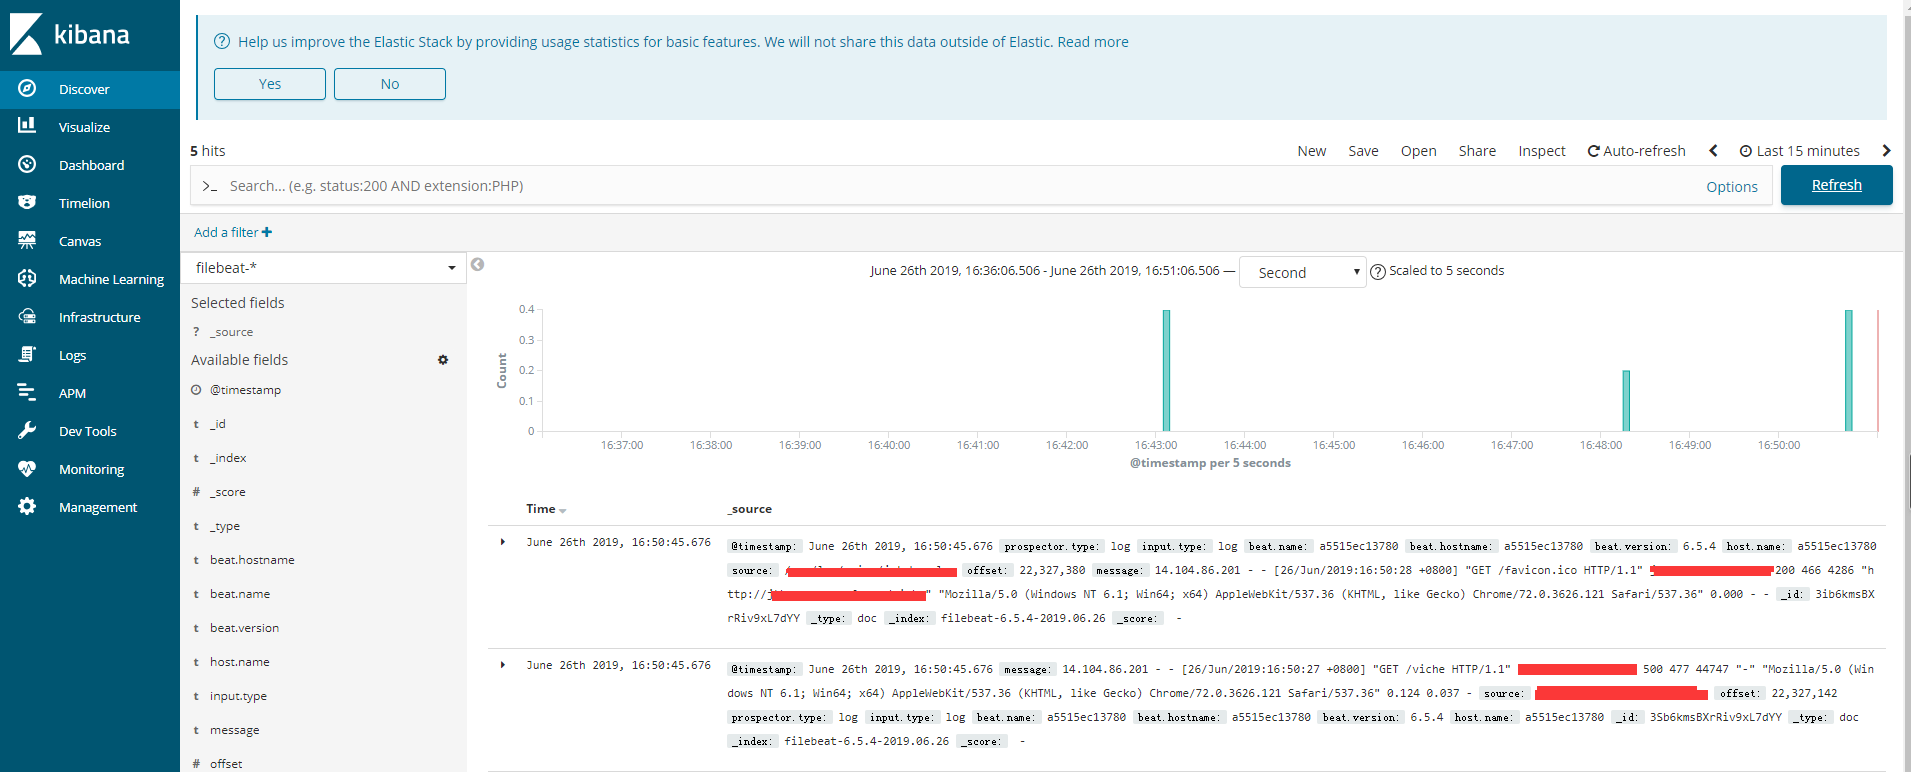
运行
docker-compose up -d
进入kibana,可以看到有数据了。


还没有评论,来说两句吧...