【SpringCloud构建微服务系列】分布式链路跟踪Spring Cloud Sleuth
一、背景
随着业务的发展,系统规模越来越大,各微服务直接的调用关系也变得越来越复杂。通常一个由客户端发起的请求在后端系统中会经过多个不同的微服务调用协同产生最后的请求结果,几乎每一个前端请求都会形成一条复杂的分布式服务调用链路,对每个请求实现全链路跟踪,可以帮助我们快速发现错误根源以及监控分析每条请求链路上性能瓶颈。
针对分布式服务跟踪,Spring Cloud Sleuth提供了一套完整的解决方案。
二、原理
参考《SpringCloud微服务实战》第11章。
先查看跟踪日志了解每项的含义
2019-02-27 20:40:56.419 INFO [service-a,e79b41414a56743d,e79b41414a56743d,true] 8276 --- [nio-9001-exec-5] cn.sp.controller.ServiceController : ==<Call Service-a>==
- 第一个值service-a:记录了应用的名称,也就是spring.application.name的值。
- 第二个值e79b41414a56743d:SpringCloudSleuth生成的一个ID,叫TraceID,它用来标识一条请求链路。一条请求链路中包含一个TraceID,多个 SpanID。
- 第三个值e79b41414a56743d,SpringCloudSleuth生成的另外一个ID,叫SpanID,它表示一个基本的工作单元,比如发送一个HTTP请求。
- 第四个值true:表示是否要将该信息输出到Zipkin等服务中收集和展示。
三、编码
3.1创建一个Eureka注册中心
这个之前的文章有,故省略
3.2调用者service-a
1.创建项目引入依赖
org.springframework.boot
spring-boot-starter-web
org.springframework.cloud
spring-cloud-starter-netflix-eureka-client
org.springframework.cloud
spring-cloud-starter-sleuth
org.springframework.cloud
spring-cloud-starter-zipkin
其实spring-cloud-starter-zipkin中已经有了sleuth的依赖,spring-cloud-starter-sleuth可以省略。
启动类
@EnableEurekaClient
@SpringBootApplication
public class ServiceAApplication {public static void main(String[] args) {SpringApplication.run(ServiceAApplication.class, args);}@Bean@LoadBalancedRestTemplate restTemplate(){return new RestTemplate();}
}
ServiceController
@RestController
public class ServiceController {private final Logger logger = LoggerFactory.getLogger(this.getClass());
@Autowiredprivate RestTemplate restTemplate;@GetMapping("/service-a")public String test(){logger.info("==<Call Service-a>==");return restTemplate.getForEntity("http://service-b/test",String.class).getBody();}}
这里的url(http://service-b/test)用的是服务名当虚拟域名而不是ip+端口号的形式,至于为什么可以访问可以查看这篇文章【Spring Cloud中restTemplate是如何通过服务名主求到具体服务的】。
4.配置文件application.yml
spring:
application:
name: service-a
zipkin:
base-url: http://localhost:9411
# 抽样收集的百分比,默认10%
sleuth:
sampler:
probability: 1
eureka:
client:
serviceUrl:
defaultZone: http://localhost:8761/eureka/
server:
port: 9001
3.3被调用者service-b
1.创建项目引入依赖pom文件同上
2.启动类添加注解 @EnableEurekaClient
3.ServiceController
@RestControllerpublic class ServiceController {private final Logger logger = LoggerFactory.getLogger(this.getClass());@GetMapping("/test")public String test(){logger.info("==<Call Service-b>==");return "OK";}}
4.配置文件application.yml
spring:
application:
name: service-b
zipkin:
base-url: http://localhost:9411
# 抽样收集的百分比,默认10%
sleuth:
sampler:
probability: 1
eureka:
client:
serviceUrl:
defaultZone: http://localhost:8761/eureka/
server:
port: 9002
3.4创建zipkin-server
pom.xml
io.zipkin.java
zipkin-server
2.12.2
org.springframework.boot
spring-boot-starter-log4j2
-
io.zipkin.java
zipkin-autoconfigure-ui
2.12.2
2.启动类添加注解 @EnableZipkinServer
注意: 这里我排除了log4j的依赖,因为已经有了相同的类文件启动会报错。
四、测试
- 依次启动eureka注册中,service-a,service-b,zipkin-server
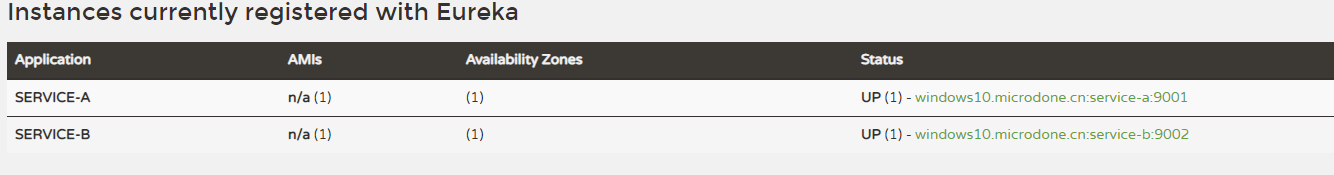
- 访问http://localhost:8761/看到有两个注册实例,说明启动成功。
- 游览器访问http://localhost:9001/service-a请求服务A
如果报错日志打印java.lang.IllegalStateException: No instances available for service-b,那可能是服务B还没注册完成等会儿再试下即可。 正常情况会看到游览器显示 OK
服务A的日志如下:2019-02-27 21:18:05.119 INFO [service-a,3e487761c9b13a2e,3e487761c9b13a2e,true] 8276 —- [nio-9001-exec-9] cn.sp.controller.ServiceController : ==
==
服务B的日志如下:
2019-02-27 21:18:05.128 INFO [service-b,3e487761c9b13a2e,8d49352c6645c6f9,true] 13860 --- [nio-9002-exec-8] cn.sp.controller.ServiceController : ==<Call Service-b>==
- 访问http://localhost:9411/zipkin/进入可视化界面
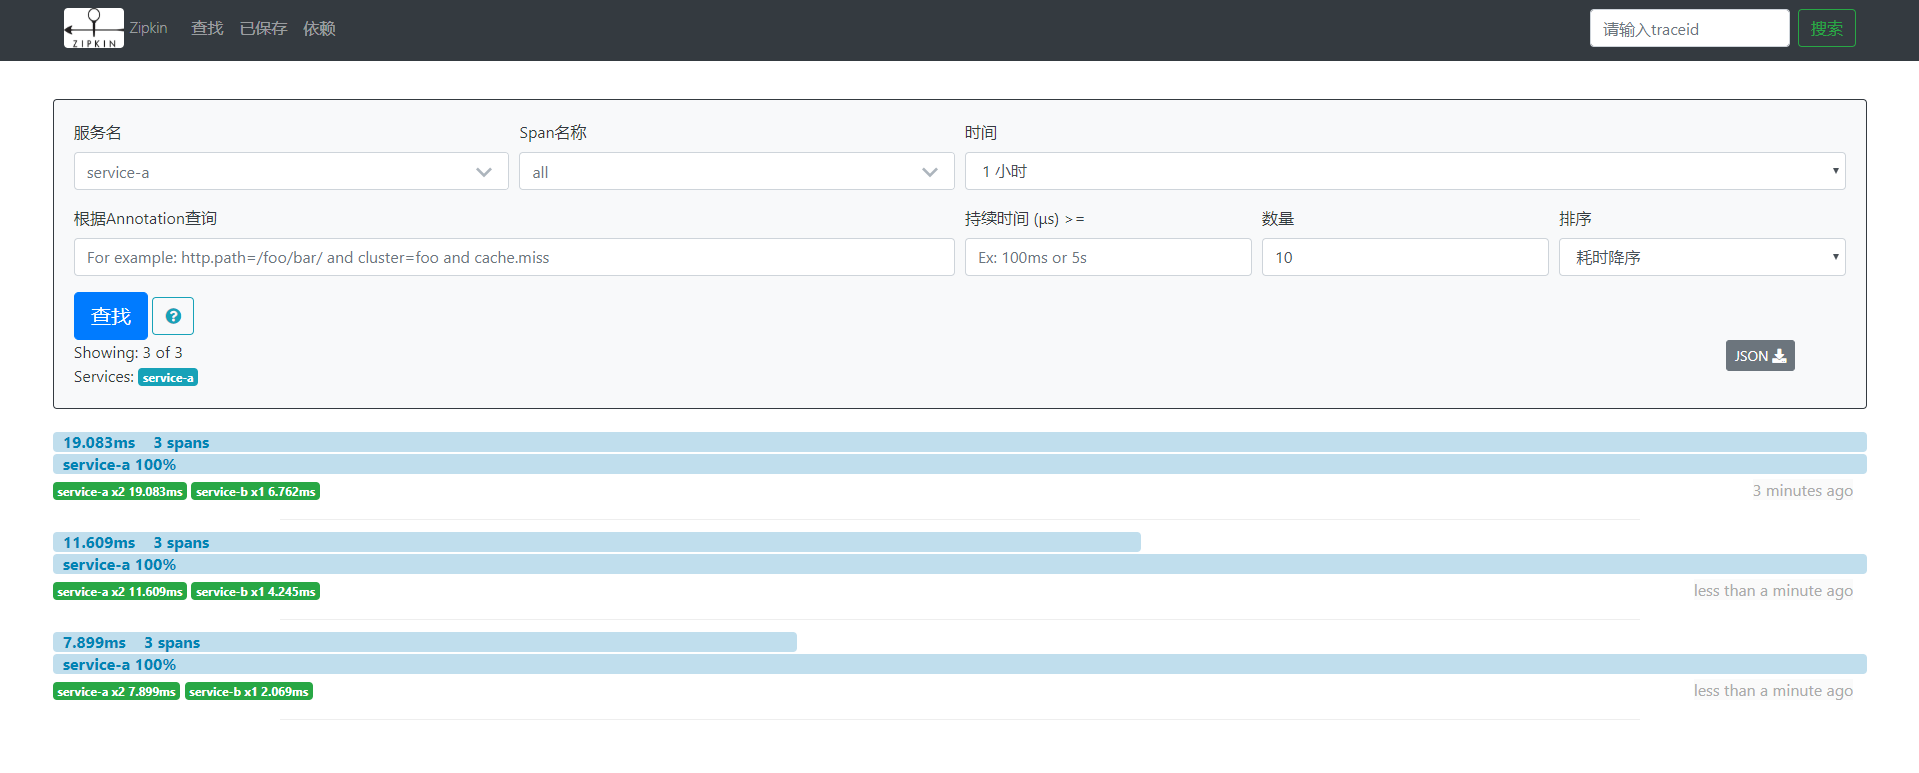
点击查找,服务名选择service-a即可看到最近的统计数据,还可以根据条件进行筛选。
点击依赖,依赖分析就可以看到服务之前的依赖关系。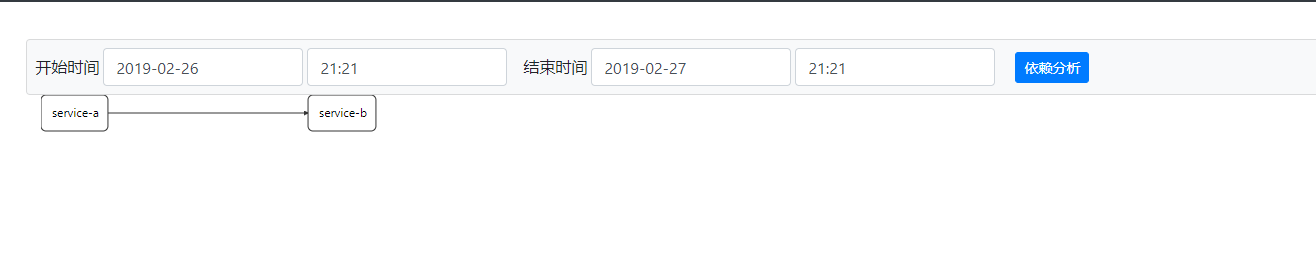
完整代码地址。
五、总结
基本是根据《SpringCloud微服务实战》这本书来的,但是中间还是踩了几个坑,比如开始报No instances available for service-b的时候我一直以为是代码哪里出了问题,浪费了很多时间。
SpringCloudSleuth除了把请求链路数据整合到Zipkin中外,还可以保存到消息队列,ELK等,还算比较强大。但是除了HTTP请求,不知道对于GRPC这样的通信方式是否也能实现链路跟踪。
查了下资料支持Grpc的,demo地址:https://github.com/tkvangorder/sleuth-grpc-sample
官方文档:https://cloud.spring.io/spring-cloud-sleuth/single/spring-cloud-sleuth.html\#\_grpc
转载于 //www.cnblogs.com/2YSP/p/10447150.html


--------代理模式")
")


还没有评论,来说两句吧...