Spring boot之Actuator
简介
Spring Boot Actuator可以帮助你监控和管理Spring Boot应用,比如健康检查、审计、统计和HTTP追踪等。所有的这些特性可以通过JMX或者HTTP endpoints来获得。
Actuator同时还可以与外部应用监控系统整合,比如 Prometheus, Graphite, DataDog, Influx, Wavefront, New Relic等。这些系统提供了非常好的仪表盘、图标、分析和告警等功能,使得你可以通过统一的接口轻松的监控和管理你的应用。
Actuator使用Micrometer来整合上面提到的外部应用监控系统。这使得只要通过非常小的配置就可以集成任何应用监控系统。
我将把Spring Boot Actuator教程分为两篇博客:
第一(本文)教你如何配置Actuator和通过Http endpoints来进入这些特征。
下一篇教你如何整合Actuator和外部应用监控系统。
第一步 创建springboot项目工程
使用idea可以快速方便的创建一个springboot项目,也可以去官网快速构建一个springboot项目,在这边博客中不是重点略过
第二步 添加依赖
pom依赖:
<dependencies><dependency><groupId>org.springframework.boot</groupId><artifactId>spring-boot-starter-actuator</artifactId></dependency></dependencies>
Gradle依赖:
dependencies {compile("org.springframework.boot:spring-boot-starter-actuator")}
写配置文件 application.yml
在原有配置基础上添加:
management:server:port: 8892endpoints:web:exposure:include: "*"exclude:endpoint:health:show-details: always
第一配置访问端口,第二是暴露所有endpoints,第三显示详细信息,大家可以修改这些配置看看结果有什么不同。
使用actuator
启动应用。访问localhost:8892/actuator 可以看见所有endpoints列表
使用Actuator Endpoints来监控应用,Actuator创建了所谓的endpoint来暴露HTTP或者JMX来监控和管理应用。默认只有health和info通过HTTP暴露了出来(把上面第二配置删除)
访问localhost:8892/actuator/health效果: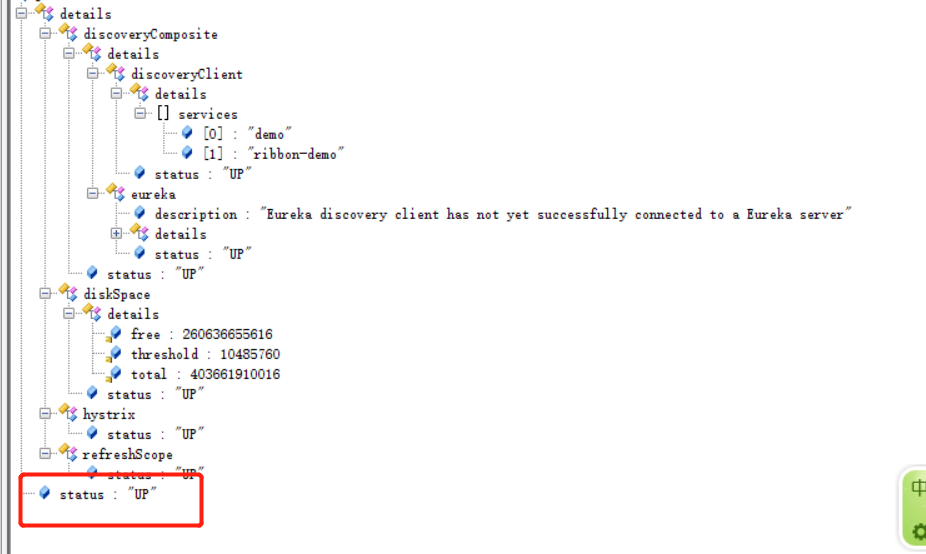
如果不配置health showdetail 只会看见红色圈住那部分。
springboot提供的部分endpoints
Endpoint ID
Description
auditevents
显示应用暴露的审计事件 (比如认证进入、订单失败)
info
显示应用的基本信息
health
显示应用的健康状态
metrics
显示应用多样的度量信息
loggers
显示和修改配置的loggers
logfile
返回log file中的内容(如果logging.file或者logging.path被设置)
httptrace
显示HTTP足迹,最近100个HTTP request/repsponse
env
显示当前的环境特性
flyway
显示数据库迁移路径的详细信息
liquidbase
显示Liquibase 数据库迁移的纤细信息
shutdown
让你逐步关闭应用
mappings
显示所有的@RequestMapping路径
scheduledtasks
显示应用中的调度任务
threaddump
执行一个线程dump
heapdump
返回一个GZip压缩的JVM堆dump
详细文档参考:官方文档
配置http jmx暴露endpoints
http:
management.endpoints.web.exposure.include=health,infomanagement.endpoints.web.exposure.exclude=
jmx:
management.endpoints.jmx.exposure.include=*management.endpoints.jmx.exposure.exclude=
常用的actuator endpoint
/health endpoint
health endpoint通过合并几个健康指数检查应用的健康情况。
Spring Boot Actuator有几个预定义的健康指标比如DataSourceHealthIndicator, DiskSpaceHealthIndicator, MongoHealthIndicator, RedisHealthIndicator, CassandraHealthIndicator等。它使用这些健康指标作为健康检查的一部分。
举个例子,如果你的应用使用Redis,RedisHealthindicator将被当作检查的一部分。如果使用MongoDB,那么MongoHealthIndicator将被当作检查的一部分。
关闭某个指标:例如mongo
management.health.mongo.enabled=false
/metrics endpoint
想要获得每个度量的详细信息,你需要传递度量的名称到URL中,像
localhost:8892/actuator/metrics/{MetricName}
ex:localhost:8080/actuator/metrics/system.cpu.usage 可以自己试试看结果
/loggers endpoint
使用localhost:8892/actuator/loggers/{name}来展示特定logger的细节
ex:localhost:8892/actuator/loggers/root来展示特定root的细节,可以自己试试结果
在运行的时候还可以改变debug日志的等级:发送一个POST请求到localhost:8892/actuator/loggers/root,加入如下参数:
{"configuredLevel": "DEBUG"}
这个功能对于线上问题的排查非常有用。同时,你可以通过传递null值给configuredLevel来重置日志等级。
自定义health指标
你可以通过实现HealthIndicator接口来自定义一个健康指标,或者继承AbstractHealthIndicator类。
@Componentpublic class CustomHealthIndicator extends AbstractHealthIndicator {@Overrideprotected void doHealthCheck(Health.Builder builder) throws Exception {// Use the builder to build the health status details that should be reported.// If you throw an exception, the status will be DOWN with the exception message.builder.up().withDetail("app", "Alive and Kicking").withDetail("error", "Nothing! I'm good.");}}
再次访问health endpoint: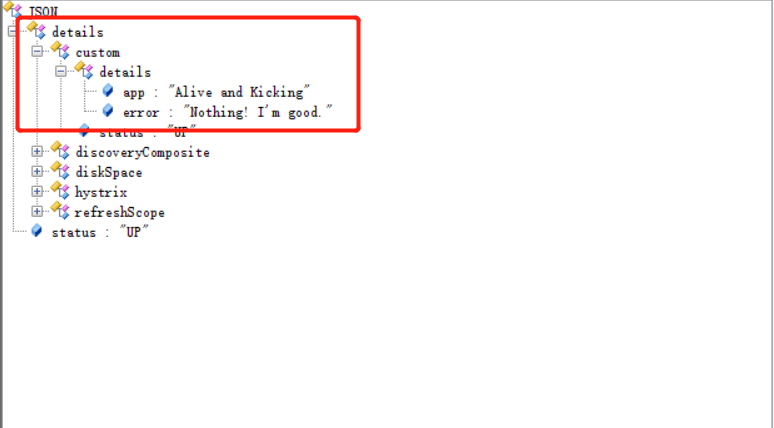
发现有我们自定义的健康检查
文章翻译:springboot actuator


")


还没有评论,来说两句吧...