微信小程序1
小程序官方:
https://mp.weixin.qq.com
小程序开发文档:
https://developers.weixin.qq.com/miniprogram/dev/index.html
微信开发社区:
https://developers.weixin.qq.com/

WePY命令行工具
npm install wepy-cli -g
在开发目录中生成Demo开发项目
wepy new myproject# 1.7.0之后的版本使用 wepy init standard myproject 初始化项目
切换至项目目录
cd myproject
安装依赖
npm install
开启实时编译
wepy build --watch
项目的目录结构:
├── dist 小程序运行代码目录(该目录由WePY的build指令自动编译生成,请不要直接修改该目录下的文件)├── node_modules├── src 代码编写的目录(该目录为使用WePY后的开发目录)| ├── components WePY组件目录(组件不属于完整页面,仅供完整页面或其他组件引用)| | ├── com_a.wpy 可复用的WePY组件a| | └── com_b.wpy 可复用的WePY组件b| ├── pages WePY页面目录(属于完整页面)| | ├── index.wpy index页面(经build后,会在dist目录下的pages目录生成index.js、index.json、index.wxml和index.wxss文件)| | └── other.wpy other页面(经build后,会在dist目录下的pages目录生成other.js、other.json、other.wxml和other.wxss文件)| └── app.wpy 小程序配置项(全局数据、样式、声明钩子等;经build后,会在dist目录下生成app.js、app.json和app.wxss文件)└── package.json 项目的package配置
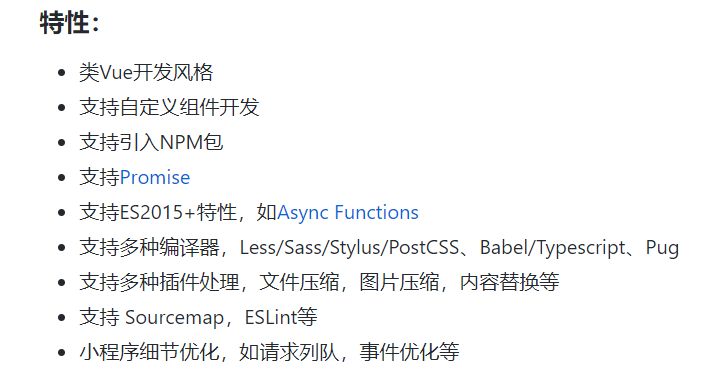
wepy 微信小程序
小程序组件化开发框架 https://tencent.github.io/wepy/

<style lang="less">@color: #4D926F;.userinfo {color: @color;}</style><template lang="pug">view(class='container')view(class='userinfo' @tap='tap')mycom(:prop.sync='myprop' @fn.user='myevent')text {{now}}</template><script>import wepy from 'wepy';import mycom from '../components/mycom';export default class Index extends wepy.page {components = { mycom };data = {myprop: {}};computed = {now () { return new Date().getTime(); }};async onLoad() {await sleep(3);console.log('Hello World');}sleep(time) {return new Promise((resolve, reject) => setTimeout(resolve, time * 1000));}}</script>
安装使用
npm install wepy-cli -gwepy init standard myprojectcd myprojectnpm installwepy build --watch


Highcharts
Report abuse
Highcharts中文官网
hcharts实现堆叠柱形图
https://www.jianshu.com/p/582299e18c7e
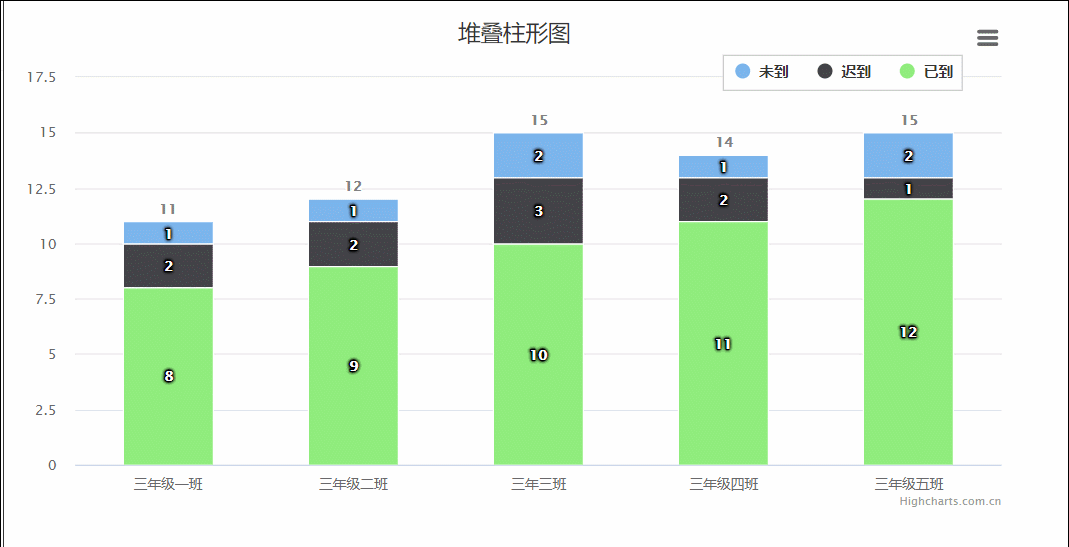
<!DOCTYPE ><html><head><meta charset="utf-8"><link rel="icon" href="https://static.jianshukeji.com/highcharts/images/favicon.ico"><meta name="viewport" content="width=device-width, initial-scale=1"><script src="https://img.hcharts.cn/jquery/jquery-1.8.3.min.js"></script><script src="https://img.hcharts.cn/highcharts/highcharts.js"></script><script src="https://img.hcharts.cn/highcharts/modules/exporting.js"></script><script src="https://img.hcharts.cn/highcharts-plugins/highcharts-zh_CN.js"></script></head><body><div id="container" style="width:800px;height:400px"></div><script>$(function () {$('#container').highcharts({chart: {type: 'column'},title: {text: '堆叠柱形图'},xAxis: {categories: ['三年级一班', '三年级二班', '三年三班', '三年级四班', '三年级五班']},yAxis: {min: 0,title: {text: ''},stackLabels: {enabled: true,style: {fontWeight: 'bold',color: (Highcharts.theme && Highcharts.theme.textColor) || 'gray'}}},legend: {align: 'right',x: -30,verticalAlign: 'top',y: 25,floating: true,backgroundColor: (Highcharts.theme && Highcharts.theme.background2) || 'white',borderColor: '#CCC',borderWidth: 1,shadow: false},tooltip: {formatter: function () {return '<b>' + this.x + '</b><br/>' +this.series.name + ': ' + this.y + '<br/>' +'总量: ' + this.point.stackTotal;}},plotOptions: {column: {stacking: 'normal',dataLabels: {enabled: true,color: (Highcharts.theme && Highcharts.theme.dataLabelsColor) || 'white',style: {textShadow: '0 0 3px black'}}}},series: [{name: '未到',data: [1, 1, 2, 1, 2]}, {name: '迟到',data: [2, 2, 3, 2, 1]}, {name: '已到',data: [8, 9, 10, 11, 12]}]});});</script></body></html>

lang:语言文字对象,所有Highcharts文字相关的设置
chart:图表区、图形区和通用图表配置选项
colors:图表数据列颜色配置,是一个颜色数组
credits: 版权信息,Highcharts在图表的右下方放置的版权信息及链
drilldown:钻取,向下钻取数据,深入到其中的具体数据
exporting:导出模块,导出功能配置,导出即将图表下载为图片或打印图表
legend:图例,用不同形状、颜色、文字等 标示不同数据列,通过点击标示可以显示或隐藏该数据列
loading:加载中,加载选项控制覆盖绘图区的加载屏的外观和文字
navigation:导航,导出模块按钮和菜单配置选项组
noData:没有数据,没有数据时显示的内容
pane:分块,针对仪表图和雷达图专用的配置,主要设置弧度及背景色
plotOptions:针对不同类型图表的配置
series:数据列,图表上一个或多个数据系列,比如图表中的一条曲线,一个柱形
title:标题,包括即标题和副标题,其中副标题为非必须的
tooltip:数据点提示框,当鼠标滑过某点时,以框的形式提示改点的数据,比如该点的值,数据单位等
Axis:坐标轴,包括x轴和y轴。多个不同的数据列可共用同一个X轴或Y轴
图表类型
line:直线图
spline:曲线图
area:面积图
areaspline:曲线面积图
arearange:面积范围图
areasplinerange:曲线面积范围图
column:柱状图
columnrange:柱状范围图
bar:条形图
pie:饼图
scatter:散点图
boxplot:箱线图
bubble:气泡图
errorbar:误差线图
funnel:漏斗图
gauge:仪表图
waterfall:瀑布图
polar:雷达图
pyramid:金字塔
全局配置Highcharts.setOptions({global: {全局参数}lang: {语言文字}});主配置Highcharts.chart('container', {accessibility: {无障碍设计}chart: {图表配置}colors: [颜色集合]credits: {版权信息}data: {数据功能模块}drilldown: {钻取}exporting: {导出}labels: {标签}legend: {图例}loading: {加载}navigation: {导航}noData: {没有数据}pane: {…}plotOptions: {数据列配置}responsive: {响应式}series: [{数据列}]subtitle: {副标题}title: {标题}tooltip: {数据提示框}xAxis: [{X 轴}]yAxis: [{Y 轴}]zAxis: {Z 轴}});函数及属性Axis: {坐标轴}Chart: {图表对象}Element: {SVG 元素}Highcharts: {命名空间}Legend: {图例}Point: {数据点}Renderer: {绘图工具}Series: {数据列}
补充了这位作者的效果图
https://www.jianshu.com/p/582299e18c7e


还没有评论,来说两句吧...